. 2022 Mar 3;185(5):847-859.e11.
doi: 10.1016/j.cell.2022.01.015. Epub 2022 Jan 24.

SARS-CoV-2 vaccination induces immunological T cell memory able to cross-recognize variants from Alpha to Omicron

Affiliations

SARS-CoV-2 vaccination induces immunological T cell memory able to cross-recognize variants from Alpha to Omicron

Alison Tarke et al. Cell. .

Abstract

We address whether T cell responses induced by different vaccine platforms (mRNA-1273, BNT162b2, Ad26.COV2.S, and NVX-CoV2373) cross-recognize early SARS-CoV-2 variants. T cell responses to early variants were preserved across vaccine platforms. By contrast, significant overall decreases were observed for memory B cells and neutralizing antibodies. In subjects ∼6 months post-vaccination, 90% (CD4+) and 87% (CD8+) of memory T cell responses were preserved against variants on average by AIM assay, and 84% (CD4+) and 85% (CD8+) preserved against Omicron. Omicron RBD memory B cell recognition was substantially reduced to 42% compared with other variants. T cell epitope repertoire analysis revealed a median of 11 and 10 spike epitopes recognized by CD4+ and CD8+ T cells, with average preservation > 80% for Omicron. Functional preservation of the majority of T cell responses may play an important role as a second-level defense against diverse variants.

Keywords: B cells; COVID-19 vaccines; Delta; Omicron; SARS-COV-2; T cells; VOC; VOI; epitopes.


Conflict of interest statement

Declaration of interests A.S. is a consultant for Gritstone Bio, Flow Pharma, Arcturus Therapeutics, ImmunoScape, CellCarta, Avalia, Moderna, Fortress, and Repertoire. S.C. has consulted for GSK, JP Morgan, Citi, Morgan Stanley, Avalia NZ, Nutcracker Therapeutics, University of California, California State Universities, United Airlines, and Roche. All the other authors declare no competing interests. L.J.I. has filed for patent protection for various aspects of T cell epitope and vaccine design work.

Figures

None
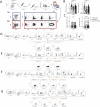
Graphical abstract
Figure S1
Figure S1
Assessment of SARS-CoV-2-specific T and B cells by flow cytometry-based assays, related to Figures 1, 2, 3, 5, and 6 (A) Gating strategy for T cell AIM, ICS, and AIM+ICS assays included in this study. These gates and antibodies are the same for all time points. Spike-specific responses are measured for both CD4+ and CD8+ T cells within the same donors using the indicated AIM markers or cytokines. (B and C) Validation of a combined AIM/ICS assay. The addition of a cocktail of brefeldin and Monesin in the ICS assay significantly decreases the detection of AIM markers, while the inclusion of the CD137 antibody in culture concomitantly, repristinates the response (B) and does not impact the IFNγ detection (C). Data are shown after background subtraction and stimulation index >2. Statistical analyses are performed using a paired Wilcoxon test. (D–G) Representative gating strategy for the memory B cell assays using spike protein at time point 3 (D) or 4 (E), or RBD at time point 3 (F) or 4 (G).
Figure 1
Figure 1
Impact of variant-associated mutations on spike-specific CD4+ and CD8+ T cell recognition T cell responses from fully vaccinated COVID-19 vaccinees were assessed with variant spike MPs. The effect of mutations associated with each variant MP was expressed as relative (fold-change variation) to the T cell reactivity detected with the ancestral strain MP. Results from COVID-19 mRNA-1273 (n = 20, circles), BNT162b2 (n = 20, triangles), and Ad26.COV2.S (n = 12, squares) vaccinees are presented together, and separately, by vaccine platform. For fold-change (FC) calculations, only donors responding to the ancestral S MP were included. (A) Representative gating of CD4+ T cells of a mRNA-1273 vaccine recipient responding to different SARS-CoV-2 variants’ MPs is shown. (B) Fold-change is calculated for AIM+ CD4+ T cells relative to the ancestral strain in COVID-19 vaccinees. (C) A representative gating example is shown for an mRNA-1273 vaccine recipient for CD8+ T cells against the SARS-CoV-2 variants in analysis. (D) Fold-change is calculated for AIM+ CD8+ T cells relative to the ancestral strain in COVID-19 vaccinees. Coefficients of variation (CV) and the geometric mean FCs for the variants are listed in each graph and plotted as log scale. Significance of FC decreases for each variant was assessed by Wilcoxon signed rank T test compared with a hypothetical median of 1. See also Figures S1, S2, and S3 and Table S1.
Figure S2
Figure S2
Magnitude of CD4+ and CD8+ T cell responses in COVID-19 fully vaccinated individuals against ancestral and variant SARS-CoV-2 spike, related to Figures 1 and 2 AIM+ and cytokine+ T cell reactivities against MPs spanning the entire sequence of different SARS-CoV-2 variants are shown for PBMCs from fully vaccinated COVID-19 mRNA-1273 (n = 20, circles), BNT162b2 (n = 20, triangles), and Ad26.COV2.S (n = 12, squares) vaccinees analyzed by vaccine platform or combined together. (A and B) Data for (A) AIM+ CD4+ and (B) AIM+ CD8+ T cells is shown. (C–G) (C) The total cytokine response of all vaccinees combined was quantified by summing spike-specific CD40L expressing CD4+ T cells also expressing (D) IFNγ, (E) TNFα, (F) IL-2, or (G) granzyme B. (H–K) For CD8+ T cells, the total cytokine response is shown (H) as calculated by the total IFNγ (I), TNFα (J), or IL-2 (K) CD8+ T cells. The frequency of response is based on the LOS (dotted line) for the ancestral response and SI > 2, while the frequency of responses across different variants is based on the number of donors responding to the ancestral spike pool. All data shown is background subtracted.
Figure 2
Figure 2
Impact of variant-associated mutations on spike-specific CD4+ and CD8+ T cell cytokine responses Fully vaccinated COVID-19 vaccinees were assessed with variant spike MPs and the effect of mutations associated with each variant MP is expressed as relative (FC variation) to the T cell reactivity detected with the ancestral strain MP and plotted as log scale. Results from COVID-19 mRNA-1273 (n = 20, circles), BNT162b2 (n = 20, triangles), and Ad26.COV2.S (n = 12, squares) vaccinees are presented together. (A) Fold-change values for cytokine+CD4+ T cells are calculated based on the sum of CD4+ T cells expressing CD40L in combination with IFNγ, TNFα, IL-2, or granzyme B. (B) The functionality of the spike-specific CD40L+ CD4+ T cell is defined by the different combinations of IFNγ, TNFα, IL-2, or granzyme B. (C and D) (C) Fold-change values for cytokine+CD8+ T cells are calculated based on the sum of CD8+ T cells producing IFNγ, TNFα, or IL-2, and (D) the functionality of the spike-specific CD8+ T cells is calculated by looking at the different combinations of IFNγ, TNFα, IL-2, or granzyme B, excluding single positive granzyme B. All data shown are background subtracted with an SI > 2. CVs and the geometric mean FCs for the variants are listed in each graph. Significance of FC decreases for each variant was assessed by Wilcoxon signed rank T test compared with a hypothetical median of 1. See also Figures S1 and S2 and Table S1.
Figure S3
Figure S3
Fold-change values and magnitude of AIM+ T cell responses 2 weeks after the first vaccine dose, related to Figure 1 CD4+ and CD8+ T cell responses were assessed with variant spike MPs 2 weeks after the donors received the first dose of COVID-19 vaccine. The effect of mutations associated with each variant MP is expressed as relative (FC variation) to the T cell reactivity detected with the ancestral strain MP. COVID-19 mRNA-1273 (n = 19, circles), BNT162b2 (n = 20, triangles), and Ad26.COV2.S (n = 12, squares) vaccinees are presented together, and separately, by vaccine platform. (A–D) The FC is calculated in respect of the ancestral strain in COVID-19 vaccinees for (A) AIM+ CD4+ and (B) AIM+ CD8+ T cells. The magnitude of AIM+ T cell reactivity against the spike MPs is shown for (C) CD4+ and (D) CD8+ T cells. The frequency of response is based on the LOS (dotted line) for the ancestral response and SI > 2, while the frequency of responses across different variants is based on the number of donors responding to the ancestral spike pool. CV and geometric mean of the FC for the variants are listed in each graph. Significance of FC decreases for each variant was assessed by Wilcoxon signed rank T test compared with a hypothetical median of 1.
Figure 3
Figure 3
Vaccinee memory T and B cell recognition of COVID-19 variants (A and B) Fully vaccinated recipients of the COVID-19 mRNA-1273 (n = 12, circles), BNT162b2 (n = 15, triangles), Ad26.COV2.S (n = 14, squares), and NVX-CoV2373 (n = 8, diamonds) vaccines were assessed for T and B cell memory to variant spikes. FC values were calculated based on the response to the ancestral spike for subjects with a measurable response and plotted as log scale. CD4+ T cell FC values are shown for (A) AIM and (B) ICS assay. (C–E) (C) The functional profile of spike-specific CD40L+CD4+ T cells was calculated as the percentage of cells with 1, 2, 3, or 4 functions defined by intracellular staining for IFNγ, TNFα, IL-2, or granzyme B. CD8+ T cell fold-change values are shown for the (D) AIM and (E) ICS assay. (F) The functional profile of cytokine producing CD8+ T cells was calculated as the percentage of cells with 1, 2, 3, or 4 functions defined by intracellular staining for IFNγ, TNFα, IL-2, or granzyme B, excluding granzyme B single positive cells. p values for the functional profile of CD4+ and CD8+ T cells were calculated by Mann-Whitney. (G–I) (G) Spike-specific cTFH+CD4+ T cells were calculated based on CXCR5+ of AIM+CD4+ T cells. SARS-CoV-2-specific memory B cells are shown to (H) spike and (I) RBD. (J–L) Variant/ancestral FC values are shown for the (J) antibody neutralization assay as well as (K) spike and (L) RBD IgG serology. The geometric mean of the FC values is listed at the bottom of each graph. Significance of FC decreases for each variant was assessed by Wilcoxon signed rank T test compared with a hypothetical median of 1. See also Figures S1 and S4 and Table S1.
Figure S4
Figure S4
Magnitude of T and B cell responses in COVID-19 vaccinated individuals 3.5 months after vaccination and antibody neutralization titer with early COVID-19 infected individuals, related to Figure 3 COVID-19 mRNA-1273 (n = 12, circles), BNT162b2 (n = 15, triangles), Ad26.COV2.S (n = 14, squares), and NVX-CoV2373 (n = 8, diamonds) vaccine recipients were assessed for T and B cell responses to variant SARS-CoV-2 spike MPs; all vaccine platforms are analyzed together. (A and B) The magnitude of response is shown for (A) CD4+ T cells in the AIM assay and (B) the sum cytokine+CD4+ T cells, which was calculated from CD40L+ CD4 cells expressing IFNγ, TNFα, IL-2, or granzyme B. (C and D) The magnitude of responding CD8+ T cells is shown for (C) the AIM assay and (D) the sum of cytokines, as calculated from the CD8+ T cells expressing IFNγ, TNFα, IL-2, or granzyme B, excluding single positive granzyme B. (E) The total magnitude of spike-specific AIM+cTFH+CD4+ T cells is shown. (F–I) The frequency of (F) spike- and (G) RBD-specific B cells among total memory B (Bmem) cells was assessed, as well as the frequency of variant-specific Bmem response within the ancestral response to (H) spike and (I) RBD. (J) The antibody neutralization assay titer is shown for COVID-19 vaccinees. (K and L) (K) The FC values are shown for early COVID-19 infected donors for the neutralization assay and (L) the magnitude of the neutralization titers for these donors. (M and N) (M) Spike and (N) RBD IgG titers are shown. The frequency of response is based on the LOS (dotted line) for the ancestral response and SI > 2, while the frequency of responses across different variants is based on the number of donors responding to the ancestral spike pool. Significance of FC decreases for each variant was assessed by Wilcoxon signed rank T test compared with a hypothetical median of 1.
Figure 4
Figure 4
Sequence conservation of SARS-CoV-2 T cell epitopes in variants (A–D) The number of epitopes fully conserved or having single or multiple mutations (including insertions/deletions) was computed across SARS-CoV-2 variants. The analysis shown represents the breakdown of conserved and mutated CD4+ (A and C) and CD8+ T cell epitopes (B and D) for all SARS-CoV-2 proteins (A and B) and spike protein only (C and D). The percentage of conserved epitopes was calculated for each variant separately. Average conservancy and standard deviations were calculated for all variants and then separately for early variants, more recent SARS-CoV-2 variants, and Omicron. (E–H) Predicted HLA binding affinities of mutated versus ancestral sequences of CD8+ T cell epitopes, based on epitope/HLA combinations curated in the IEDB data as of July 2021. Predicted HLA binding values to the relevant HLA allelic variant were calculated using the IEDB recommended NetMHCpanEL 4.1 (Reynisson et al., 2020) algorithm. Points outside the dotted lines in each panel indicate instances where the predicted HLA binding capacity of the mutated peptide was increased (>3-fold) or decreased (<3-fold). (E) Early, (F) late, and (G) Omicron SARS-CoV-2 variants are shown. (H) Percentage of mutated CD8+ T cell epitopes associated with a 3-fold decrease in predicted binding capacity. Comparisons of epitopes conservancy across early and current variants were performed by unpaired Mann-Whitney test. Comparison with the Omicron variant was performed by one sample T test. Large font bold numbers indicate average conservation in all variants (black), Delta (ocher), and Omicron (dark red). See also Tables S3 and S4.
Figure 5
Figure 5
Impact of Omicron and other variants on memory T cell and B cell recognition The response to SARS-CoV-2 variants was assessed in individuals 5–6 months after full vaccination with mRNA-1273 (n = 12, circles) and BNT162b2 (n = 7, triangles) COVID-19 vaccines. (A and B) The FC values are shown for (A) memory B cell responses to spike and (B) RBD Omicron compared with other variants. (C) The FC values for CD4+ T cell responses by AIM are shown. (D) The FC of all cytokine+CD4+ T cells is calculated from the sum of CD4+ cells expressing CD40L in combination with IFNγ, TNFα, IL-2, or granzyme B. (E) The FC values for CD8+ T cell responses measured by AIM are shown. (F) The FC of all cytokine+CD8+ T cells, as calculated from the sum of IFNγ, TNFα, or IL-2. The geometric mean of the FC values for each variant is listed in each graph and plotted as log scale. Significance of FC decreases for each variant was assessed by Wilcoxon signed rank T test compared with a hypothetical median of 1. See also Figure S5 and Table S1.
Figure S5
Figure S5
Response to SARS-CoV-2 variants in fully vaccinated donors 5–6 months after vaccination, related to Figure 5 5–6 months after vaccination, COVID-19 mRNA-1273 (n = 12, circles) and BNT162b2 (n = 7, triangles) vaccine recipients were assessed for T cell responses to variant spikes by AIM and ICS assays. (A and B) The frequency of (A) Omicron spike- and (B) RBD-specific B cells among total Bmem cells was assessed and compared with frequency of B cell recognizing other variants. (C and D) In addition, frequency of Omicron-specific Bmem response within the ancestral response to (C) Spike and (D) RBD was determined. (E) The magnitude of response is shown for AIM+CD4+ T cells. (F) The total cytokine response for CD4+ T cells is calculated by summing the CD40L+ cells also expressing IFNγ+, TNFα+, IL-2+, or granzyme B+. (G) The CD4+ T cell response to the Omicron variant is shown for AIM and ICS, including the FC values and magnitude, and those values are duplicated in (E) and (F) and Figures 5C and 5D. (H and I) For CD8+ T cells, (H) the magnitude of AIM+CD8+ T cells is shown and (I) the total cytokine+CD8+ T cells calculated by summing the IFNγ+, TNFα+, IL-2+, or granzyme B+ CD8+ T cells, excluding granzyme B single positive cells. (J) The FC values and magnitude of response is shown for the CD8+ T cell responses to the Omicron variant by AIM and ICS, and those values are duplicated in (H) and (I) and Figures 5E and 5F. The frequency of response is based on the LOS (dotted line) for the ancestral response and SI > 2, while the frequency of responses across different variants is based on the number of donors responding to the ancestral spike pool. Significance of FC decreases for each variant was assessed by Wilcoxon signed rank T test compared with a hypothetical median of 1. COVID-19 mRNA-1273 (circles), BNT162b2 (triangles), Ad26.COV2.S (squares), and NVX-CoV2373 (diamonds) vaccine recipients were assessed for T cell responses to variant spikes by AIM assay at various time points, ranging from 2 weeks after the first dose to 5–6 months after the last dose of vaccine. (K and L) The correlation of magnitude and FC values (K) AIM+ CD4+ or (L) CD8+ T cells was analyzed for all time points combined (n = 183 donors). R and p values are the results of a Pearson correlation.
Figure 6
Figure 6
Impact of SARS-CoV-2 variants on spike epitope repertoires of fully vaccinated donors 5–6 months after vaccination The response to SARS-CoV-2 variants was assessed in individuals 5–6 months after full vaccination with mRNA-1273 (n = 4, circles). (A–D) (A) CD4+ T cell epitope repertoires were determined for four mRNA-1273 vaccinees, and (C) CD8+ T cell epitope repertoires were determined for three mRNA-1273 vaccinees (no CD8+ T cell response was measurable for donor 6,263) by testing the inferred HLA class I restricted epitopes based on the individual HLA-A, -B, and -C typing and applying the NetMHCpan EL4.1 algorithm implemented in the IEDB with a 4th percentile cutoff. The percent of T cell response associated with conserved epitopes for each individual donor for (B) CD4+ and (D) CD8+ T cells is shown for each variant assessed. Each graph shows the total response detected with the ancestral spike MP, and the summed total response detected against each of the individual epitopes identified. The histograms show the percentage of the total response accounted from each epitope, where black bars indicate non-mutated epitopes, while mutated epitopes are represented by open bars, with color coding further indicating which variant mutations are associated with the epitope. Based on these data, the fraction of the total response to each variant that can be accounted for by non-mutated epitopes can be calculated, as also shown in the graph. See also Tables S1, S2, S3, and S5.

References

    1. Callaway E. Beyond Omicron: what's next for COVID's viral evolution. Nature. 2021;600:204–207. - PubMed
    1. Cameroni E., Saliba C., Bowen J.E., Rosen L.E., Culap K., Pinto D., De Marco A., Zepeda S.K., di Iulio J., Zatta F., et al. Broadly neutralizing antibodies overcome SARS-CoV-2 Omicron antigenic shift. bioRxiv. 2021 doi: 10.1101/2021.12.12.472269. - DOI - PMC - PubMed
    1. Carreño J.M., Alshammary H., Tcheou J., Singh G., Raskin A., Kawabata H., Sominsky L., Clark J., Adelsberg D.C., Bielak D., et al. Activity of convalescent and vaccine serum against a B.1.1.529 variant SARS-CoV-2 isolate. medRxiv. 2021 doi: 10.1101/2021.12.20.21268134. - DOI - PubMed
    1. Cele S., Jackson L., Khan K., Khoury D.S., Moyo-Gwete T., Tegally H., Scheepers C., Amoako D., Karim F., Bernstein M., et al. SARS-CoV-2 Omicron has extensive but incomplete escape of Pfizer BNT162b2 elicited neutralization and requires ACE2 for infection. medRxiv. 2021 doi: 10.1101/2021.12.08.21267417. - DOI
    1. Chakraborty C., Sharma A.R., Bhattacharya M., Agoramoorthy G., Lee S.-S. Evolution, mode of transmission, and mutational landscape of newly emerging SARS-CoV-2 variants. mBio. 2021;12 - PMC - PubMed

MeSH terms

Supplementary concepts