. 2020 Jan 23;180(2):387-402.e16.
doi: 10.1016/j.cell.2019.12.023.

Quantitative Proteomics of the Cancer Cell Line Encyclopedia

Affiliations

Quantitative Proteomics of the Cancer Cell Line Encyclopedia

David P Nusinow et al. Cell. .

Abstract

Proteins are essential agents of biological processes. To date, large-scale profiling of cell line collections including the Cancer Cell Line Encyclopedia (CCLE) has focused primarily on genetic information whereas deep interrogation of the proteome has remained out of reach. Here, we expand the CCLE through quantitative profiling of thousands of proteins by mass spectrometry across 375 cell lines from diverse lineages to reveal information undiscovered by DNA and RNA methods. We observe unexpected correlations within and between pathways that are largely absent from RNA. An analysis of microsatellite instable (MSI) cell lines reveals the dysregulation of specific protein complexes associated with surveillance of mutation and translation. These and other protein complexes were associated with sensitivity to knockdown of several different genes. These data in conjunction with the wider CCLE are a broad resource to explore cellular behavior and facilitate cancer research.

Keywords: CCLE; MSI; RNA/Protein correlation; TMT; cancer cell lines; microsatellite instability; protein expression; quantitative proteomics; systems biology.


Figures

Figure 1.
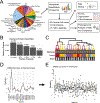
Figure 1.. Quantitative Proteomic analysis of 375 diverse cancer cell lines.
(A) Overview of the data set and analyses conducted. (B) Overlap of proteins quantified across all samples. (C) Clustering of biological replicates (n=3) for the first 18 cell lines. Tissues are colored as in panel A. (D) ERBB2 (HER2) protein expression in the biological replicate set shows high levels in a single breast cancer line. Colored dots show individual replicates and the line is the mean. (E) ERBB2 protein expression across the full data set. Cell lines are arranged along the x-axis by ERBB2 copy number. Cell lines with increased copy number (left) have high levels of ERBB2 and are frequently breast derived (yellow). See also Tables S1-3.
Figure 2.
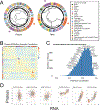
Figure 2.. Correlation between protein and RNA expression.
(A) Hierarchical clustering using proteins quantified in all samples (left) and their corresponding RNASeq expression (middle). (B) Correlation between samples for protein expression (y-axis) and RNASeq (x-axis). In all cases the most highly correlated RNASeq sample to any given protein sample was the same cell line. Clusters of similarity for lymphoid lines and skin lines are highlighted in A-B with orange and purple asterisks respectively. (C) Per-gene Pearson correlation between protein and RNA expression for all proteins quantified. Mean correlation is 0.48 (dashed line). The locations of several cancer-related genes are shown. (D) Examples of the RNA and protein expression for both low (left) and high (right) correlating genes. See also Table S4.
Figure 3.
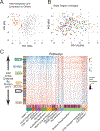
Figure 3.. The primary variation in protein expression for most cell lines is organized by coordinated expression of protein complexes and cellular pathways.
(A) PCA of the protein expression data for all samples. Dark orange points are haematopoetic and lymphoid lineages. (B) PCA projection after removing haematopoetic-and lymphoid-derived lines. (C) Heatmap of coordinated expression levels of example pathways. The x-axis is individual proteins belonging to the annotated complex or pathway. The y-axis is the cell lines rank ordered by the PC1 projection (x-axis in panel B). The Pearson correlation between protein and RNA expression for each individual gene is annotated along the x-axis. Examples of commonly used cell lines are annotated. Colors in B and y-axis of C are lineages as in Figure 1A. See also Table S5.
Figure 4.
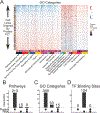
Figure 4.. Coordinated expression across biological processes is associated with the major variation in the cellular proteome.
(A) Selected GO categories enriched in the PC1 loadings. As in Figure 3C, cell lines are arranged in rank order according to PC1 projection. (B-D) GSEA on the PC1 loadings for both protein expression and RNASeq data were performed separately using (B) pathway (C) GO and (D) transcription factor binding site databases. The number of enriched gene sets for each is shown as is the overlap between the protein and RNA.
Figure 5.
Figure 5.. Microsatellite Instability is associated with downregulation of multiple protein complexes.
(A) Overlap of significantly up-and downregulated mRNA and protein levels associated with MSI status. (B) High confidence protein associations taken from the STRING database are plotted as a network and colored according to complex membership. Only connected nodes are shown. (C) Expression levels (y-axis) of proteins in Microsatellite Stable (MSS, left) and MSI (right) for the complex members shown in panel B. Boxplots are standard, showing the median at the horizontal line, first and third quartiles at the hinges, and the whiskers at the most extreme values no further than 1.5 times the interquartile range beyond the hinge.
Figure 6.
Figure 6.. Associations between protein complexes altered in MSI cell lines.
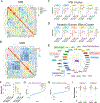
(A-B) Heatmaps of the correlation matrix between all proteins altered in MSI cell lines that were quantified in all samples. Correlations are for protein expression levels in MSI (A) and MSS lines (B). (C-D) Protein complex members are differentially expressed according to a combination of MSI status and total mutation burden. Some proteins are associated with MSI alone (C) or a combination of MSI and total mutation burden (D). (E) Significant associations between mutated genes (arrow base) and protein expression levels (arrowheads) are plotted as a network. RPL22 mutation is significantly associated with expression changes in the same protein complex members as are altered in MSI. (F) RPL22 and RPL22L1 expression levels as in (C-D). (G-H) Protein expression associations with sensitivity to shRNA knockdown of WRN (G) and RPL22L1 (H). Proteins are ranked along the x-axis by their linear model test statistic and arranged according to that test statistic along the y-axis. Significantly associated proteins are shown in red and labeled. (I) H3K4me1 and me2 levels in MSS and MSI cell lines. Boxplots are as in Figure 5.
Figure 7:
Figure 7:. Protein complexes are associated with specific gene knockdown sensitivities and mutations.
(A) Heatmap of fraction of protein complex members that were significantly associated with sensitivity to shRNA knockdown of different genes. All listed complexes have at least half of their members associated with a knockdown. (B-I) Example associations between gene knockdown sensitivity (x-axis) and protein expression (y-axis). (B) ATR and (C) ATRIP expression compared to sensitivity to ATR knockdown. (D) MCM2 and (E) MCM4 members of the MCM complex compared to MDM knockdown sensitivity. (F) AURKB and (G) INCENP members of the CTR complex compared to sensitivity to TP53 knockdown. (H) SAE1 and (I) UBA2 expression compared to sensitivity to WRN knockdown. (J) Fractions of protein complex members associated with specific gene mutations. (K-L) Expression of (K) SAE1 and (L) UBA2 compared to PCSK7 mutation status. Boxplots are as in Figure 5. Scatterplot trendlines are linear regression with the 95% Cl shaded grey.

References

    1. Baretti M, and Le DT (2018). DNA mismatch repair in cancer. Pharmacology & Therapeutics 189, 45–62. - PubMed
    1. Barretina J, Caponigro G, Stransky N, Venkatesan K, Margolin AA, Kim S, Wilson CJ, Lehár J, Kryukov GV, Sonkin D, et al. (2012). The Cancer Cell Line Encyclopedia enables predictive modelling of anticancer drug sensitivity. Nature 483, 603–307. - PMC - PubMed
    1. Basu A, Bodycombe NE, Cheah JH, Price EV, Liu K, Schaefer GI, Ebright RY, Stewart ML, Ito D, Wang S, et al. (2013). An Interactive Resource to Identify Cancer Genetic and Lineage Dependencies Targeted by Small Molecules. Cell 154,1151–1161. - PMC - PubMed
    1. Behan FM, lorio F, Picco G, Gonçalves E, Beaver CM, Migliardi G, Santos R, Rao Y, Sassi F, Pinnelli M, et al. (2019). Prioritization of cancer therapeutic targets using CRISPR-Cas9 screens. Nature 568, 511. - PubMed
    1. Brandman O, Stewart-Ornstein J, Wong D, Larson A, Williams CC, Li G-W, Zhou S, King D, Shen PS, Weibezahn J, et al. (2012). A Ribosome-Bound Quality Control Complex Triggers Degradation of Nascent Peptides and Signals Translation Stress. Cell 151,1042–1054. - PMC - PubMed

Publication types