. 2013 Dec 6;8(12):e82032.
doi: 10.1371/journal.pone.0082032. eCollection 2013.

The Pseudomonas syringae pv. tomato type III effector HopM1 suppresses Arabidopsis defenses independent of suppressing salicylic acid signaling and of targeting AtMIN7

Affiliations

The Pseudomonas syringae pv. tomato type III effector HopM1 suppresses Arabidopsis defenses independent of suppressing salicylic acid signaling and of targeting AtMIN7

Anju Gangadharan et al. PLoS One. .

Abstract

Pseudomonas syringae pv tomato strain DC3000 (Pto) delivers several effector proteins promoting virulence, including HopM1, into plant cells via type III secretion. HopM1 contributes to full virulence of Pto by inducing degradation of Arabidopsis proteins, including AtMIN7, an ADP ribosylation factor-guanine nucleotide exchange factor. Pseudomonas syringae pv phaseolicola strain NPS3121 (Pph) lacks a functional HopM1 and elicits robust defenses in Arabidopsis thaliana, including accumulation of pathogenesis related 1 (PR-1) protein and deposition of callose-containing cell wall fortifications. We have examined the effects of heterologously expressed HopM1Pto on Pph-induced defenses. HopM1 suppresses Pph-induced PR-1 expression, a widely used marker for salicylic acid (SA) signaling and systemic acquired resistance. Surprisingly, HopM1 reduces PR-1 expression without affecting SA accumulation and also suppresses the low levels of PR-1 expression apparent in SA-signaling deficient plants. Further, HopM1 enhances the growth of Pto in SA-signaling deficient plants. AtMIN7 contributes to Pph-induced PR-1 expression. However, HopM1 fails to degrade AtMIN7 during Pph infection and suppresses Pph-induced PR-1 expression and callose deposition in wild-type and atmin7 plants. We also show that the HopM1-mediated suppression of PR-1 expression is not observed in plants lacking the TGA transcription factor, TGA3. Our data indicate that HopM1 promotes bacterial virulence independent of suppressing SA-signaling and links TGA3, AtMIN7, and other HopM1 targets to pathways distinct from the canonical SA-signaling pathway contributing to PR-1 expression and callose deposition. Thus, efforts to understand this key effector must consider multiple targets and unexpected outputs of its action.


Conflict of interest statement

Competing Interests: The authors have declared that no competing interests exist.

Figures

Figure 1
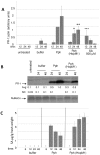
Figure 1. HopM1 suppresses Pph-induced PR-1 expression without reducing accumulation of SA.
A) Col-0 leaves were infiltrated with buffer, Pph, or Pph (HopM1), sprayed with 500 µM SA, or left untreated. Quantitative real time PCR (qRT-PCR) was used to measure the amount of PR-1 transcript (relative to actin) at 12, 24, and 48 hai. The graph shows combined values from three independent biological replicates normalized with Pph in Col-0 at 24 hai set to 1. Error bars represent standard deviations. Paired two-tailed t-tests indicate that Pph (HopM1) induced less PR-1 transcript than Pph at 24 (*, P = 0.0001) and 48 (**, P = 0.004) hai. PR-1 accumulation with SA treatment was also significantly higher compared to Pph infiltration at 12 hai (***, P = 0.02). B) From leaves treated as in (A), total protein was extracted at 24 and 48 hai and subjected to anti-PR-1 immunoblotting. PR-1 protein in each sample was quantified and normalized with the value for Pph at 48 hai set to 1. The numbers shown below the blots indicate the average and standard deviation of combined data from three independent biological replicates. Paired two-tailed t-tests indicate that Pph (HopM1) induce less PR-1 protein than Pph at both 24 and 48 hai (P≤0.05). The cross-reacting band above PR-1 and ponceau staining of RuBisCo indicate equal loading of samples. C) From leaves treated as in (A), SA was extracted at 6, 12, 24, and 48 hai and measured by HPLC. Shown is the combined data from three biological replicates and error bars represent standard deviations. Samples marked with asterisks (*) contained too little SA for accurate quantification.
Figure 2
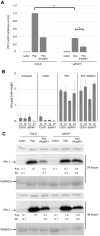
Figure 2. HopM1 suppresses Pph-induced PR-1 expression in SA-signaling deficient backgrounds.
A) Col-0 and SA-signaling mutant plants were infiltrated with buffer, Pph, or Pph (HopM1) and the amount of PR-1 protein was measured by immunoblotting at 24 and 48 hai. Quantified data were normalized with the amount of PR-1 induced by Pph in Col-0 set to 1. The average and standard deviation of values from three independent biological replicates are shown below the PR-1 blot. SD values for those samples that showed detectable PR-1 levels in only one replicate are not calculated (-). Ponceau stains of the membranes demonstrating equal protein loading are shown below. B) Plants were treated as in (A) and SA levels in leaves were measured at 12 and 24 hai. Shown is the combined data from three independent biological replicates and error bars represent standard deviations.
Figure 3
Figure 3. AtMIN7 positively regulates Pph-induced PR-1 transcript accumulation without affecting accumulation of SA.
A) Col-0 or atmin7 plants were infiltrated with buffer, Pph, or Pph (HopM1). PR-1 transcript levels were measured by qRT-PCR at 28 hai. The graph shows combined data from three independent biological replicates normalized with Pph in Col-0 set to 1. Paired two-tailed t-tests indicate significant differences between PR-1 transcript levels induced by Pph in Col-0 versus atmin7 and by Pph versus Pph (HopM1) in atmin7 plants (*, P<0.001). B) Plants were treated as in (A) and SA levels in leaves were measured at 12 and 24 hai. Shown is the combined data from three independent biological replicates and error bars represent standard deviations. Paired two-tailed t-tests indicate that SA levels induced by Pph in Col-0 versus atmin7 differed at 12 hai (P = 0.03) and that differences with Pph versus Pph (HopM1) in Col-0 or atmin7 were not apparent at 12 or 24 hai (P≥0.5). C) Plants were treated as in (A) and total protein samples from 24 and 48 hai were subjected to anti-PR-1 immunoblotting. Quantified data were normalized with the amount of PR-1 protein induced by Pph in Col-0 set to 1. The average and standard deviation values for four independent biological replicates are shown below the blots. Paired two-tailed t-tests did not show significant differences between PR-1 levels in Col-0 versus atmin7 plants infiltrated with Pph or Pph (HopM1) (P≥0.3). The cross-reacting band above PR-1 and ponceau staining of RuBisCo indicate equal loading of samples.
Figure 4
Figure 4. The positive contribution of AtMIN7 to Pph-induced PR-1 transcript accumulation is independent of SA-signaling.
A) Col-0 or atmin7 plants were sprayed with water, infiltrated with Pph, or sprayed with 300 µM SA. PR-1 transcript levels were measured by qRT-PCR at 12 and 24 hours after spray or infiltration. Samples were normalized with the value for Pph in Col-0 at 24 hai set to 1 and the averages and standard deviations of data from four independent biological replicates is shown. Paired two-tailed t-tests indicate that transcript levels induced by SA spray did not vary significantly in Col-0 versus atmin7 at 12 or 24 hai (P≥0.7). B) Plants were treated as in (A) and 48 hours after spray or infiltration total protein from treated leaves was subjected to anti-PR-1 immunoblotting. Quantified data were normalized with the amount of PR-1 protein induced by SA in Col-0 set to 1. Average and standard deviations from three independent biological replicates are shown below the blot. The cross-reacting band above PR-1 and ponceau staining of RuBisCo indicate equal loading of samples.
Figure 5
Figure 5. Targets of HopM1 other than AtMIN7 are critical to Pph-induced defense responses.
A) Col-0 plants were infiltrated with buffer, Pph, Pph (HopM1) or Col-0 and atmin7 plants were left untreated. AtMIN7 protein levels were measured from samples collected at 9 and 24 hai by immunoblotting. Quantified data were normalized with the amount of AtMIN7 protein present in untreated Col-0 at each time point set to 1.The average and standard deviations from multiple replicates are shown below the blots. Ponceau staining of RuBisCo indicate equal loading. B) Col-0 or atmin7 plants were infiltrated with buffer, Pph, or Pph (HopM1). After 16 hours, leaves were cleared and stained with aniline blue and visualized by fluorescent microscopy. Representative pictures are shown. The scale bar in the bottom right picture is 100 microns. C) Image J was used to count small and big callose deposits. Shown are the average and standard deviations from three independent biological replicates. Paired two-tailed t-tests indicate that the callose deposits induced in Col-0 versus atmin7 did not differ for Pph or Pph (HopM1) (P>0.6).
Figure 6
Figure 6. TGA3 is a positive regulator of Pph-induced PR-1 protein accumulation.
Col-0, tga256, and tga2356 plants were infiltrated with buffer, Pph or Pph(HopM1) and PR-1 protein levels were measured from samples collected at 24 and 48hai by immunoblotting. Protein levels were quantified and the data were normalized with amount of protein induced by Pph at each time point set to 1. The average and standard deviations from multiple replicates are shown below the blots. Ponceau staining of RuBisCo indicate equal loading.
Figure 7
Figure 7. HopM1 suppresses SA independent defense responses to promote bacterial virulence.
A) Col-0 and SA-signaling deficient plants were infiltrated with Pto, PtoΔCEL and PtoΔCEL (HopM1) at a concentration of 105 CFU/ml. Growth of bacteria was assessed at 4 days after infiltration. Shown is the combined data and standard deviations from 3 independent biological replicates. The dashed line represents bacterial levels at day 0. Paired two-tailed t-tests were used to compare the growth of individual strains in sid2npr1 versus sid2 or npr1 (ns, not significant; *, P≤0.05; **, P<0.0001). B) Plants were infiltrated with buffer, PtoΔCEL or PtoΔCEL (HopM1) and SA levels in leaves were measured at 15 hai. Shown is the combined data from three independent biological replicates and error bars represent standard deviations. Asterisks (*) indicate that SA levels were below the limit of detection (0.05 µg of SA/g fresh weight).

References

    1. Chisholm ST, Coaker G, Day B, Staskawicz BJ (2006) Host-microbe interactions: shaping the evolution of the plant immune response. Cell 124: 803–814. - PubMed
    1. Mackey D, McFall AJ (2006) MAMPs and MIMPs: proposed classifications for inducers of innate immunity. Molecular microbiology 61: 1365–1371. - PubMed
    1. Jones JD, Dangl JL (2006) The plant immune system. Nature 444: 323–329. - PubMed
    1. Clay NK, Adio AM, Denoux C, Jander G, Ausubel FM (2009) Glucosinolate metabolites required for an Arabidopsis innate immune response. Science 323: 95–101. - PMC - PubMed
    1. Glazebrook J (2005) Contrasting mechanisms of defense against biotrophic and necrotrophic pathogens. Annu Rev Phytopathol 43: 205–227. - PubMed

Publication types

MeSH terms