. 2013 Nov 13;5(211):211ra156.
doi: 10.1126/scitranslmed.3006534.

Restoration of the unfolded protein response in pancreatic β cells protects mice against type 1 diabetes

Affiliations

Restoration of the unfolded protein response in pancreatic β cells protects mice against type 1 diabetes

Feyza Engin et al. Sci Transl Med. .

Erratum in

  • Sci Transl Med. 2013 Dec 4;5(214):214er11. Ngyuen, Truc [corrected to Nguyen, Truc]

Abstract

Perturbations in endoplasmic reticulum (ER) homeostasis can evoke stress responses leading to aberrant glucose and lipid metabolism. ER dysfunction is linked to inflammatory disorders, but its role in the pathogenesis of autoimmune type 1 diabetes (T1D) remains unknown. We identified defects in the expression of unfolded protein response (UPR) mediators ATF6 (activating transcription factor 6) and XBP1 (X-box binding protein 1) in β cells from two different T1D mouse models and then demonstrated similar defects in pancreatic β cells from T1D patients. Administration of a chemical ER stress mitigator, tauroursodeoxycholic acid (TUDCA), at the prediabetic stage resulted in a marked reduction of diabetes incidence in the T1D mouse models. This reduction was accompanied by (i) a significant decrease in aggressive lymphocytic infiltration in the pancreas, (ii) improved survival and morphology of β cells, (iii) reduced β cell apoptosis, (iv) preserved insulin secretion, and (v) restored expression of UPR mediators. TUDCA's actions were dependent on ATF6 and were lost in mice with β cell-specific deletion of ATF6. These data indicate that proper maintenance of the UPR is essential for the preservation of β cells and that defects in this process can be chemically restored for preventive or therapeutic interventions in T1D.


Figures

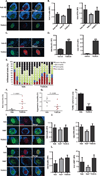
Fig. 1
Fig. 1. Time-course detection of altered expression of UPR mediators in the islets of NOD mice
Female NOD mice (n = 14 for each group) were sacrificed at 3,5,7,9, and 13 weeks of age. (A and B) Immunofluorescence assays were performed on the pancreatic sections by costaining with either (A) anti-ATF6 antibody (red) or (B) anfrsXBPI (red) and anti-insulin (green) antibodies. The cell nuclei were counterstained with 4’,6-diamidino-2-phenylindole (DAPI) (blue). (C to E) Relative fluorescence intensity (RFI) for (C) ATF6, (D) sXBPI, and (E) insulin was calculated by MATLAB (15 to 25 islets per animal per time point). (F) Serum insulin levels of NOD mice (n = 14) were measured by enzyme-linked immunosorbent assay (EUSA). All data are presented as means ± SEM, with statistical analysis performed by one-way analysis of variance (ANOVA) (***P < 0.001; **P < 0.005; *P < 0.05).
Fig. 2
Fig. 2. Dysregulated UPR expression in the β cells of human T1D patients
(A and B) Pancreatic sections from nondiabetic (Ctrl) and diabetic female patients were grouped and costained with either (A) anti-ATF6 (red) and anti-insulin (green) or (B) anti-sXBPI (red) and anti-insulin (green). The cell nuclei were counterstained with DAPI (blue). (C to E) Relative fluorescence intensity (RFI) of (C) insulin, (D) sXBPI, and (E) ATF6 in the pancreatic sections was calculated on 15 to 25 islets per time point. All data are presented as means ± SEM, with statistical analysis performed by one-way ANOVA (***P < 0.001; **P < 0.005; *P < 0.05).
Fig. 3
Fig. 3. Decreased diabetes incidence in NOD and RIP-LCMV-GP mice upon treatment with TUDCA
(A) Female NOD mice (n = 20 in each group) received twice-daily intraperitoneal injections of TUDCA (250 mg/kg) or vehicle (PBS) starting at 10 weeks of age, and blood glucose levels were monitored up to 30 weeks of age. (B) The same treatment was applied to RIP-LCMV-GP mice (n = 12) right after induction of diabetes with LCMV [2 × 10³ plaque-forming units (PFU)/ml], and blood glucose levels were monitored for 2 weeks. (C) Reduction of diabetes incidence with various doses of TUDCA in RIP-LCMV-GP animals was determined after 2 weeks of treatment. (D) Serum insulin levels were measured by ELISA in vehicle (PBS)–treated NOD mice without diabetes (Veh-ND), vehicle-treated NOD mice with diabetes (Veh-D), or TUDCA-treated NOD mice (TUDCA). (E) Pancreatic sections from vehicle (PBS)– or TUDCA-treated NOD mice (30 weeks of age) were stained with H&E. Representative images of vehicle-treated mice without diabetes (Veh-ND) are presented in the upper panel. TUDCA treatment (lower panel) resulted in better-preserved islet morphology and less lymphocytic infiltration compared to vehicle-treated diabetic (Veh-D) NOD mice (middle panel). Immunofluorescence analysis of these islets with anti-insulin and anti-glucagon antibodies indicated the presence of functional β and α cells in TUDCA-treated mice. (F) Pancreatic sections from vehicle-treated (PBS) (upper panel) or TUDCA-treated (lower panel) RIP-LCMV-GP mice were stained with H&E (left panels) or examined by insulin and glucagon immunofluorescence analysis (right panels). Data are presented as means ± SEM, with statistical analysis performed by the Kaplan-Meier estimate (A), χ2test (B), or one-way ANOVA (D) (***P < “ 0.001; *P< 0.05).
Fig. 4
Fig. 4. Lack of TUDCA-induced alterations in immune cell populations in NOD pancreata
Ten-week-old female NOD mice were treated with TUDCA (500 mg/kg per day) or vehicle (PBS) (n = 7 in each group) for 4 weeks. Each pancreas was isolated and dispersed, and cells were analyzed by flow cytometry after staining with antibodies against CD45, CD4, CD8, CD19, CD25, and Foxp3. Cells were pregated as CD45+. (A) Fractions of CD4+ or CD8+ T cells in representative dot plots. (B and C) Summary data for all mice. (D and E) Corresponding dot plots and summary data for Foxp3+ cells pregated as CD45+ and CD4+. (F and G) Corresponding dot plots and summary data for CD19+ B cells pregated as CD45+. Student′s t test did not show any significant statistical difference between vehicle- and TUDCA-treated cells.
Fig. 5
Fig. 5. Recovery of adaptive UPR mediators in islets of TUDCA-treated NOD and RIP-LCMV-GP mice
(A) Pancreatic sections from 30-week-old vehicle-treated non-diabetic (Veh-ND) (n = 5), vehicle-treated diabetic (Veh-D) (n = 4), and TUDCA-treated (n = 9) NOD mice stained with anti-ATF6 (red) and anti-insulin (green). The cell nuclei were counterstained with DAPI (blue). (B) Quantification of relative fluorescence intensity (RFI) of insulin and ATF6 in the islets of vehicle-treated nondiabetic (Veh-ND), vehicle-treated diabetic (Veh-D), and TUDCA-treated NOD mice. (C) Pancreatic sections from 16-week-old vehicle-treated diabetic (upper panel) or TUDCA-treated RIP-LCMV-GP (lower panel) mice stained with anti-ATF6 (red) and anti-insulin (green). The cell nuclei were counterstained with DAPI (blue). (D) Quantification of islet fluorescence intensity of insulin and ATF6 in vehicle- and TUDCA-treated mice. (E) Insulitis scoring was performed on the H&E-stained step sections of the pancreata from 10-week-old NOD mice treated with either PBS vehicle (n = 8) or TUDCA (n = 8) for 4 weeks. (F) Vehicle- or TUDCA-treated NOD mouse islets were quantified for the presence of islets that did not display insulitis (*P < 0.05). (G) Vehicle- or TUDCA-treated NOD mouse islets were quantified for the presence of the islets that displayed aggressive insulitis. TUDCA-treated mice had significantly lower percentages of islets with aggressive insulitis. (H) Pancreata from control and TUDCA-treated animals were assessed for apoptosis with the TUNEL assay. (I and K) Vehicle- and TUDCA-treated normoglycemic NOD mouse pancreata were costained with (I) anti-ATF6 (red) or (K) anti-sXBPI (red) and anti-insulin (green) antibodies. Vehicle-treated animals were grouped according to their insulitis scoring [determined in (E)], and the group with the lowest insulitis scoring is shown in the upper panel. Vehicle-treated animals with severe insulitis were indicated as Veh* (middle panel). The staining of TUDCA-treated animals is shown in the lower panel. Relative fluorescence intensity analysis indicated significantly reduced (J) ATF6 and (L) sXBPI expression in the group with higher insulitis scoring, whereas TUDCA-treated animals showed a similar degree of expression to the animals with lower insulitis scoring. Insulin expression in the islets was the same in all groups (J and L). Data are presented as means ± SEM, with statistical analysis performed by one-way ANOVA (B, J, and L) or by Student′s t test (D and F to H) (***P < 0.001; *P < 0.05).
Fig. 6
Fig. 6. TUDCA-driven protection of β cells against cytokine- and ER stress-induced cell death
(A) Pancreatic sections from vehicle- or TUDCA-treated RIP-LCMV-GP mice were assessed for apoptosis with the TUNEL assay. White arrowheads indicate TUNEL-positive cells. (B) Min6 cells were treated with tunicamycin (1 µg/ml) for 18 hours with or without TUDCA, and cell death was determined with the TUNEL assay. (C) Min6 cells were treated as in (B),and markers of apoptosis were analyzed by Western blotting with anti-p-JNK, anti-CHOP, anti-cleaved PARP, and anti-caspase-3 antibodies. (D) Min6 cells were treated with 1 µM thapsigargin with or without 250 µM TUDCA for 24 hours. Cell viability was assessed with the XTT {sodium 3′-[(1-phenyl amino-carbonyl)-3,4-tetrazolium]-bis(4-methoxy-6-nitro)benzene sulfonic acid hydrate} assay. (E) Min6 cells were treated with a cytokine cocktail with or without 250 µM TUDCA for 40 hours. Cell viability was assessed with the XTT assay. (F) Min6 cells transduced with a lentivirus expressing 3XFIag-tagged ATF6. After treatment of Min6 cells with 3 µM doxycycline for 24 hours, 1 µM thapsigargin was added to the medium for 24 hours, and cell viability was determined with the XTT assay. (G) Transduced Min6 cells were treated with 3 µM doxycycline for 24 hours, the cytokine cocktail was added to the medium for 24 hours, and cell viability was determined with the XTT assay. (H) Transduced Min6 cells were treated with 3 µM doxycycline for 24 hours, 1 µM thapsigargin was added to the medium, and incubation was continued for an additional 24 hours. Apoptosis markers were analyzed by Western blotting with anti-CHOP and anti-caspase-3 antibodies. (I) Transduced Min6 cells were treated with either vehicle or 0.1 µM doxycycline for 24 hours. Thapsigargin (1 µM) was added to the medium, incubation was continued for an additional 24 hours in the presence or absence of 30 µM TUDCA, and then cell viability was determined with the XTT assay. (J) Cultured Min6 cells were transduced with a lentivirus expressing 3XFIag-tagged ATF6 and then treated with either vehicle or 3 µM doxycycline for 24 hours. Thapsigargin (1 µM) was then added to the medium, incubation was continued for an additional 24 hours in the presence or absence of 50 µM TUDCA, and GSIS under low- and high-glucose conditions was determined by insulin ELISA Results were replicated in three independent experiments. Data are presented as means ± SEM, with statistical analysis performed by Student′s f test (A, B, and D to G) or one-way ANOVA (I and J) (***P < 0.001; *P < 0.05).
Fig. 7
Fig. 7. TUDCA protection of β cells through the ATF6 branch of the UPR
(A) Schematic representation of a targeting vector used for the generation of conditional β cell-specific ATF6-deficient (ATF6β−/−) mice. (B) Genotyping of control and ATF6β−/− mice was performed with tail DNA. (C) An immunofluorescence assay was performed to validate the tissue-specific deletion of ATF6. (D) Vehicle (PBS) or TUDCA (250 mg/kg twice daily via intraperitoneal injection) was applied to ATF6 wild-type (wt) control mice or ATF6β−/− RIP-LCMV-GP mice immediately after induction of diabetes with LCMV (2 × 10³ PFU/ml), and blood glucose levels were monitored for 2 weeks. (E) Female control and ATF6β−/−; RIP-LCMV-GP; lns2Cre mice were treated with either vehicle or TUDCA (n = 4 each group) for 2 weeks. (F) The mice were then sacrificed, and the relative immunofluorescence intensity (RFI) of insulin (green) or sXBPI (red) expression (20 to 30 islets per animal per group) was quantified by MATLAB. (G) Pancreatic sections from vehicle- or TUDCA-treated control and ATF6β−/− RIP-LCMV-GP mice (n = 4 each group, 20 to 30 islets per group) were examined for apoptosis with the TUNEL assay. All data are presented as means ± SEM, with statistical analysis performed by one-way ANOVA (***P < 0.001; **P < 0.005; *P < 0.05).

Comment in

References

    1. Lehuen A, Diana J, Zaccone P, Cooke A. Immune cell crosstalk in type 1 diabetes. Nat. Rev. Immunol. 2010;10:501–513. - PubMed
    1. Mathis D, Vence L, Benoist C. β-Cell death during progression to diabetes. Nature. 2001;414:792–798. - PubMed
    1. van Belle TL, Coppieters KT, von Herrath MG. Type 1 diabetes: Etiology immunology and therapeutic strategies. Physiol. Rev. 2011;91:79–118. - PubMed
    1. Eizirik DL, L Colli M, Ortis F. The role of inflammation in insulitis and β-cell loss in type 1 diabetes. Nat. Rev. Endocrinol. 2009;5:219–226. - PubMed
    1. Todd DJ, Lee AH, Glimcher LH. The endoplasmic reticulum stress response in immunity and autoimmunity. Nat. Rev. Immunol. 2008;8:663–674. - PubMed

Publication types