. 2012 Mar 14:13:12.
doi: 10.1186/1471-2172-13-12.

Molecular pathway profiling of T lymphocyte signal transduction pathways; Th1 and Th2 genomic fingerprints are defined by TCR and CD28-mediated signaling

Affiliations

Molecular pathway profiling of T lymphocyte signal transduction pathways; Th1 and Th2 genomic fingerprints are defined by TCR and CD28-mediated signaling

Ruben L Smeets et al. BMC Immunol. .

Abstract

Background: T lymphocytes are orchestrators of adaptive immunity. Naïve T cells may differentiate into Th1, Th2, Th17 or iTreg phenotypes, depending on environmental co-stimulatory signals. To identify genes and pathways involved in differentiation of Jurkat T cells towards Th1 and Th2 subtypes we performed comprehensive transcriptome analyses of Jurkat T cells stimulated with various stimuli and pathway inhibitors. Results from these experiments were validated in a human experimental setting using whole blood and purified CD4+ Tcells.

Results: Calcium-dependent activation of T cells using CD3/CD28 and PMA/CD3 stimulation induced a Th1 expression profile reflected by increased expression of T-bet, RUNX3, IL-2, and IFNγ, whereas calcium-independent activation via PMA/CD28 induced a Th2 expression profile which included GATA3, RXRA, CCL1 and Itk. Knock down with siRNA and gene expression profiling in the presence of selective kinase inhibitors showed that proximal kinases Lck and PKCθ are crucial signaling hubs during T helper cell activation, revealing a clear role for Lck in Th1 development and for PKCθ in both Th1 and Th2 development. Medial signaling via MAPkinases appeared to be less important in these pathways, since specific inhibitors of these kinases displayed a minor effect on gene expression. Translation towards a primary, whole blood setting and purified human CD4+ T cells revealed that PMA/CD3 stimulation induced a more pronounced Th1 specific, Lck and PKCθ dependent IFNγ production, whereas PMA/CD28 induced Th2 specific IL-5 and IL-13 production, independent of Lck activation. PMA/CD3-mediated skewing towards a Th1 phenotype was also reflected in mRNA expression of the master transcription factor Tbet, whereas PMA/CD28-mediated stimulation enhanced GATA3 mRNA expression in primary human CD4+ Tcells.

Conclusions: This study identifies stimulatory pathways and gene expression profiles for in vitro skewing of T helper cell activation. PMA/CD3 stimulation enhances a Th1-like response in an Lck and PKCθ dependent fashion, whereas PMA/CD28 stimulation results in a Th2-like phenotype independent of the proximal TCR-tyrosine kinase Lck. This approach offers a robust and fast translational in vitro system for skewed T helper cell responses in Jurkat T cells, primary human CD4+ Tcells and in a more complex matrix such as human whole blood.


Figures
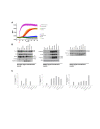
Figure 1
Figure 1
Signal transduction in Jurkat T cells. Jurkat T cells were stimulated with different combinations of stimuli in order to elucidate the different signal transduction pathways. A; Jurkat T cells were stimulated as indicated and intracellular Ca2+ release was monitored over/in time. B; Intracellular signal transduction routes were charted via phosphoanalysis using western blot. Jurkat T cells were stimulated for 15 min using different stimulations. Proximal (Lck, ZAP70, PKCθ and the PKC substrate MARCKs), medial (MAPK phosphorylation) and distal (c-Jun and ATF2) signaling was monitored based on the phosphorylation status of the described proteins. C; Nuclear translocation of the transcription factors NFAT, NFkB and c-Jun was evaluated 15 minutes after stimulation.
Figure 2
Figure 2
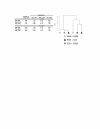
PMA/CD3 and CD3/28 stimulations differ from PMA/CD28 stimulation. The table shows the number of regulated probe sets and their overlap at 1 and 8 hrs following stimulation with CD3/PMA, PMA/CD28 and CD3/CD28 (using a fold change cut off of 2 and a p-value cut off of < 1.10-6). The right panel shows a hierarchical clustering of the data using the data for the regulated probe sets. Most of the variation is caused by the time difference (1 hr vs 8 hrs). At both time points the PMA/CD28 stimulus was clearly different from the CD3/CD28 and CD3/PMA stimulus. Repeating this analysis with different values for the fold change and p-value cut off yielded essentially the same results for the multivariate analysis.
Figure 3
Figure 3
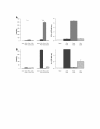
Differential regulation of IL-2 and CCL1. Jurkat T cells were activated for 1 and 8 hours using different stimuli (as indicated). Differentially regulated genes of which the proteins were secreted were identified and the highest ranking genes were selected. A; regulation of the CCL1 mRNA is highly and differentially regulated after PMA/CD28 stimulation. Right panel shows the validation of the mRNA levels on protein level, secreted by activated Jurkat T cells. B; regulation of IL-2 mRNA is highly and differentially regulated after CD3/28 and PMA/CD3 stimulation. Right panel shows the validation of the mRNA levels on protein, secreted by activated Jurkat T cells.
Figure 4
Figure 4
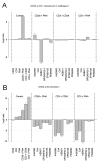
Involvement of signal transduction pathways on differentially regulated genes. Jurkat T cells were stimulated as indicated previously and the involvement of different signaling pathways on gene regulation was elucidated using inhibitors of specific pathways, including Lck (1 μM), PKC (10 μM), Calcineurin (1 μM), and MAPKs p38, JNK, and MEK/ERK (all 10 μM). A; Regulation of CCL1 mRNA in Jurkat T cells after stimulation with PMA/CD28-, CD3/28- or PMA/CD3-and co-incubated and cultured for 8 hours in the presence or absence of signal transduction pathway inhibitors. B; Regulation of IL-2 mRNA in Jurkat T cells after stimulation with PMA/CD28-, CD3/28- and PMA/CD3- and co-incubated and cultured for 8 hours in the presence or absence of signal transduction pathway inhibitors. The height of the bars represent the average intensity of 3 biological replicates, the error bars indicate the variation (min and max values). Significance of changes in expression level between the stimulated sample and the sample that was stimulated in the presence of the pathway inhibitor is indicated as follows; *** P value < 0.0001; ** 0.01 <P value > 0.001* 0.05 <P value > 0.01.
Figure 5
Figure 5
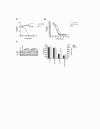
PMA/CD28-induced CCL1 production is not dependent on the Lck/Cn pathway. Jurkat T cells were stimulated using PMA/CD3 and PMA/CD28 in the presence of Lck (A420983), Cn (CsA) and PKC (AEB071) pathway inhibitors for 24 hours. Dose- response effects of the inhibitors were evaluated on the production of CCL1, after PMA/CD28 stimulation (A) and IL-2 after PMA/CD3 stimulation (B) in supernatant of the cell cultures. The data are representative for 3 independent experiments. C; Knock down of Lck and PKCθ resulted in a clear dose-dependent reduction of the protein (500, 100, 20 nM siRNA). 24 hour culture supernatants were collected after stimulation with PMA/CD28 and PMA/CD3 and the effect of knock down on respectively CCL1 and IL-2 was determined. Data of two independent experiments are presented as mean + SEM. Significance of differences are indicated by ** p < 0.01, *p < 0.05, # no difference using a one-way ANOVA with a Bonferroni's post-hoc test. N.b the values shown in this figure are log2 values no to be confused with the intensity values as shown in figure 3.
Figure 6
Figure 6
Heatmap of stimulation dependent gene clusters. Top left panel: CCL1 cluster characterized by induction of genes exclusively following CD28/PMA stimulation and subsequent repression by AEB071. Bottom left panel: IL-2 cluster characterized by induction of genes by all stimulations, and down-regulated by A420983 and AEB071 and to a lesser extent by CsA. Top right panel: EGR1 cluster characterized by induction of genes by all stimulations, but down-regulated only by AEB071 when stimulated with PMA/CD28 or PMA/CD3. A red color denotes an up-regulation, a green color a down-regulation. The MAPK inhibitors induced very little regulation and have been omitted from this figure for clarity. The gene lists shown in this figure, with extended annotation and their distance to the CCL1, IL-2 and EGR1 profiles are provided in Additional files: File S1, S2 and S3.
Figure 7
Figure 7
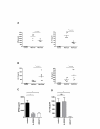
PMA/CD3 and PMA/CD28 stimulation differentially modulate primary T cell cytokine responses in human healthy donor blood. Healthy donor blood was stimulated with PMA/CD3 and PMA/CD28 and cultured for 24 hours in the presence or absence of pathway inhibitors for Lck and PKC. Culture supernatants were analyzed on A; IFNγ, IL-17 (Th1/17 cytokines) and B; IL-13 and IL-5 (Th2 cytokines). Figure C shows the involvement of Lck (420983; 1 μM) and PKC (AEB071; 1 μM) signal transduction on PMA/CD3-induced IFNγ production. Figure D shows the effect of Lck (A-420983; 1 μM)) and PKC (AEB071; 1 μM) signal transduction pathways on PMA/CD28-induced IL-13 production. Data are presented as results from 3 donors measured as biological duplicates. Significance of differences are presented as followed; * p < 0.05, **p < 0.01 using a one-way ANOVA with Dunnett's post hoc testing.
Figure 8
Figure 8
PMA/CD3 and PMA/CD28 effects on purified primary human CD4+ T cells. Purified CD4+ T cells were stimulated with anti-CD3/CD28, PMA/CD3 and PMA/CD28 and cultured for 24 hours in the presence or absence of pathway inhibitors for Lck (A420983; 1 μM) and PKC(AEB071; 1 μM). Culture supernatants were analyzed for IFNγ, production (A), mRNA expression of the Th1 master transcription factor T-bet (B), the production of the Th2 cytokine IL-13 (C) and expression of the Th2 master transcription factor GATA3 (D). Message RNA expression was normalized against ribosomal house hold gene RPL19. Data are presented of three independent experiments using purified human CD4+ T cells from three different healthy donors. Data are presented as mean + SD. Significance of differences are indicated by ** p < 0.01, * p < 0.05, using a mann-withney U-test.

References

    1. Murphy KM, Reiner SL. The lineage decisions of helper T cells. Nat Rev Immunol. 2002;2:933–944. doi: 10.1038/nri954. - DOI - PubMed
    1. Szabo SJ, Sullivan BM, Peng SL, Glimcher LH. Molecular mechanisms regulating Th1 immune responses. Annu Rev Immunol. 2003;21:713–758. doi: 10.1146/annurev.immunol.21.120601.140942. - DOI - PubMed
    1. Dardalhon V, Korn T, Kuchroo VK, Anderson AC. Role of Th1 and Th17 cells in organ-specific autoimmunity. J Autoimmun. 2008;31:252–256. doi: 10.1016/j.jaut.2008.04.017. - DOI - PMC - PubMed
    1. Wan YY, Flavell RA. How diverse-CD4 effector T cells and their functions. J Mol Cell Biol. 2009;1:20–36. doi: 10.1093/jmcb/mjp001. - DOI - PMC - PubMed
    1. Brogdon JL, Leitenberg D, Bottomly K. The potency of TCR signaling differentially regulates NFATc/p activity and early IL-4 transcription in naive CD4+ T cells. J Immunol. 2002;168:3825–3832. - PubMed

MeSH terms