Comparative Study
. 2010 Dec 14;49(49):10473-85.
doi: 10.1021/bi101596g. Epub 2010 Nov 15.

Elucidation of inositol hexaphosphate and heparin interaction sites and conformational changes in arrestin-1 by solution nuclear magnetic resonance

Affiliations
Comparative Study

Elucidation of inositol hexaphosphate and heparin interaction sites and conformational changes in arrestin-1 by solution nuclear magnetic resonance

Tiandi Zhuang et al. Biochemistry. .

Abstract

Arrestins specifically bind activated and phosphorylated G protein-coupled receptors and orchestrate both receptor trafficking and channel signaling through G protein-independent pathways via direct interactions with numerous nonreceptor partners. Here we report the first successful use of solution NMR in mapping the binding sites in arrestin-1 (visual arrestin) for two polyanionic compounds that mimic phosphorylated light-activated rhodopsin: inositol hexaphosphate (IP6) and heparin. This yielded an identification of residues involved in the binding with these ligands that was more complete than what has previously been feasible. IP6 and heparin appear to bind to the same site on arrestin-1, centered on a positively charged region in the N-domain. We present the first direct evidence that both IP6 and heparin induced a complete release of the arrestin C-tail. These observations provide novel insight into the nature of the transition of arrestin from the basal to active state and demonstrate the potential of NMR-based methods in the study of protein-protein interactions involving members of the arrestin family.


Figures
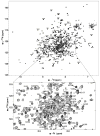
Figure 1
Figure 1
2-D 1H-15N TROSY spectrum of 0.2mM U-2H,15N-arrestin-1 in 25 mM Bis-Tris, 150 mM NaCl, 5 mM mercaptoethanol, pH=6.5 acquired at 308 K using a Bruker Avance 800MHz spectrometer. 152 assigned residues are labeled.
Figure 2
Figure 2
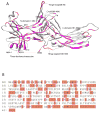
(A) Crystal structure of arrestin-1 (Protein Databank code: 1CF1) with key regions labeled. The red circle represents the polar core area. The black ellipse represents the 3-element interaction involving N-terminus, C-terminus and alpha-helix 1. Numbers in parenthesis represent the start residue and the end residue. Residues for which backbone resonance assignments were made are highlighted in magenta. (B) Mapping of sites for which backbone resonance assignments were completed (highlighted in red) to the amino acid sequence of arrestin-1.
Figure 3
Figure 3
2D 1H-15N TROSY spectrum of 0.2mM selectively 15N-isoleucine-labeled arrestin-1 in 25 mM Bis-Tris, 150mM NaCl and 5mM mercaptoethanol, pH=6.5 at 308 K using a Bruker Avance 800MHz spectrometer. 11 out of 20 isoleucine residue peaks were assigned, as labeled in the spectrum.
Figure 4
Figure 4
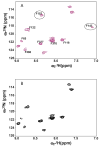
Application of paramagnetic relaxation enhancement for validation of backbone NMR resonance assignments. Top: 1H,15N-TROSY spectrum of 0.15 mM selectively 15N-phenylalanine-labeled arrestin-1 (T157C, C63A, C128S, C143S, F85A, F197A mutant form with the MTSL spin label attached at C157) with reduced (diamagnetic) spin-label. Bottom: 1H,15N TROSY spectra of 0.15 mM selectively-15N-phenylalanine -labeled arrestin-1 (T157C, C63A, C128S, C143S, F85A, F197A mutant form with the MTSL spin label attached at C157) with oxidized (paramagnetic) spin-label. Peaks that disappeared (F152, F147) in the paramagnetic case are circled. Both spectra were acquired in a buffer containing 25 mM Bis-Tris, 150 mM NaCl, 5 mM mercaptoethanol, pH=6.5 at 298 K using a Bruker Avance 800MHz spectrometer.
Figure 5
Figure 5
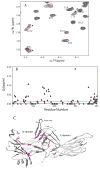
Titration of arrestin-1 with IP6, as monitored by NMR. (A) Overlapping of 2D TROSY spectra of 0.15 mM 15N-labeled arrestin-1 with different concentrations of IP6. Protein:ligand molar ratios are: Black 1:0, Blue 1:0.5, Red 1:1, Purple 1:2, Magenta 1:5, Green 1:10. Samples were prepared at 25 mM Bis-Tris, 150 mM NaCl and 5 mM mercaptoethanol pH 6.5 and acquired at 308 K using a Bruker Avance 800MHz spectrometer. (B) Plot of chemical shift changes along the sequence of arrestin-1 (assigned residues) when the IP6 binding site of arrestin-1 is near saturation. Triangles represent the chemical shift changes for 0.15 mM 15N labeled arrestin-1 induced by the presence of 1.5mM IP6. The chemical shift changes are calculated as described in Materials and Methods. The magenta line indicates the 0.01 ppm experimental uncertainty associated with the chemical shift measurements. (C) Residues for which amide peaks exhibited more than 0.01 ppm chemical shift change in the present of 10-fold molar excess of IP6 were mapped onto the crystal structure of arrestin-1 (highlighted in magenta).
Figure 6
Figure 6
Titration of arrestin-1 with heparin, as monitored by NMR. (A) Overlapping of 2D TROSY spectra of 0.1mM 2H,15N-labeled arrestin-1 with different concentrations of heparin. Protein:ligand molar ratios are: Green 1:0, Red 1:0.5, Yellow 1:1, Blue 1:2 and Magenta 1:5. Samples were prepared and acquired in the same conditions as in Figure 6A. (B) Plot of chemical shift changes for assigned resonances along the sequence of arrestin-1 when the heparin binding site of arrestin-1 is near saturation. Black circles illustrate the chemical shift changes for 0.1 mM 15N labeled arrestin-1 induced by the presence of 0.5mM heparin. The chemical shift changes are calculated as described in Materials and Methods. The magenta line indicates experimental uncertainty associated with the chemical shift measurements. (C) Residues for which amide peaks exhibited more than 0.01 ppm chemical shift changes in the present of 5-fold molar excess of IP6 were mapped onto the crystal structure of arrestin-1 (highlighted in magenta).
Figure 7
Figure 7
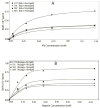
Determination of ligand-arrestin-1 dissociation constants from the NMR titration data. (A) Chemical shift changes of residues (A64, I16, L172, Y67) are plotted as a function of IP6 concentration, to which was fit a 1:1 binding model using NMRView titration analysis module to obtain dissociation constants. (B) Chemical shift changes of residues (A64, I16, L172, Y67) are plotted as a function of heparin concentration, with the same analysis of the data and the determination of apparent dissociation constants Kd,app being performed as in (A).
Figure 8
Figure 8
Release of the arrestin-1 C-tail upon association of arrestin-1 heparin or IP6, as revealed by T2 relaxation rate changes. (a) Transverse relaxation times (T2) for arrestin-1 backbone amide 15N in the absence (blue bar) and in the presence of 5-fold molar excess of heparin (red bar), as measured at 308 K and 800 MHz. (b) Transverse relaxation times (T2) for arrestin-1 backbone amide 15N in the absence (blue bar) and in the presence of 10-fold molar excess of IP6 (red bar) at 308 K and 800 MHz.

References

    1. Gurevich VV, Gurevich EV. The molecular acrobatics of arrestin activation. Trends Pharmacol Sci. 2004;25:59–112. - PubMed
    1. Goodman OB, Krupnick JG, Santini F, Gurevich VV, Penn RB, Gagnon AW, Keen JH, Benovic JL. Beta-arrestin acts as a clathrin adaptor in endocytosis of the beta2-adrenergic receptor. Nature. 1996;383:447–450. - PubMed
    1. Laporte SA, Oakley RH, Holt JA, Barak LS, Caron MG. The interaction of beta-arrestin with the AP-2 adaptor is required for the clustering of beta 2-adrenergic receptor into clathrin-coated pits. J Biol Chem. 2000;275:23120–23126. - PubMed
    1. DeWire SM, Ahn S, Lefkowitz RJ, Shenoy SK. beta-arrestins and cell signaling. Annu Rev Physiol. 2007;69:483–510. - PubMed
    1. Gurevich EV, Gurevich VV. Arrestins: ubiquitous regulators of cellular signaling pathways. Genome Biol. 2006;7 - PMC - PubMed

Publication types