. 2008 Nov;103(6):537-51.
doi: 10.1007/s00395-008-0740-1. Epub 2008 Jul 19.

Effects of unipolar stimulation on voltage and calcium distributions in the isolated rabbit heart

Affiliations

Effects of unipolar stimulation on voltage and calcium distributions in the isolated rabbit heart

Veniamin Y Sidorov et al. Basic Res Cardiol. 2008 Nov.

Abstract

Background: The effect of electric stimulation on the polarization of cardiac tissue (virtual electrode effect) is well known; the corresponding response of intracellular calcium concentration ([Ca(2+)](i)) and its dependence on coupling interval between conditioning stimulus (S1) and test stimulus (S2) has yet to be elucidated.

Objective: Because uncovering the transmembrane potential (V(m))-[Ca(2+)](i) relationship during an electric shock is imperative for understanding arrhythmia induction and defibrillation, we aimed to study simultaneous V(m) and [Ca(2+)](i) responses to strong unipolar stimulation.

Methods: We used a dual-camera optical system to image concurrently V (m) and [Ca(2+)](i) responses to unipolar stimulation (20 ms +/- 20 mA) in Langendorff-perfused rabbit hearts. RH-237 and Rhod-2 fluorescent dyes were used to measure V(m) and [Ca(2+)](i), respectively. The S1-S2 interval ranged from 10 to 170 ms to examine stimulation during the action potential.

Results: The [Ca(2+)](i) deflections were less pronounced than changes in V(m) for all S1-S2 intervals. For cathodal stimulation, [Ca(2+)](i) at the central virtual cathode region increased with prolongation of S1-S2 interval. For anodal stimulation, [Ca(2+)](i) at the central virtual anode area decreased with shortening of the S1-S2 interval. At very short S1-S2 intervals (10-20 ms), when S2 polarization was superimposed on the S1 action potential upstroke, the [Ca(2+)](i) distribution did not follow V(m) and produced a more complex pattern. After S2 termination [Ca(2+)](i) exhibited three outcomes in a manner similar to V(m): non-propagating response, break stimulation, and make stimulation.

Conclusions: Changes in the [Ca(2+)](i) distribution correlate with the behavior of the V (m) distribution for S1-S2 coupling intervals longer than 20 ms; at shorter intervals S2 creates more heterogeneous [Ca(2+)](i) distribution in comparison with V(m). Stimulation in diastole and at very short coupling intervals caused V(m)-[Ca(2+)](i) uncoupling at the regions of positive polarization (virtual cathode).


Figures
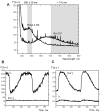
Figure 1
Figure 1. Rhod-2AM and RH-237 fluorescence measured in the heart
(A) Emission spectra of Rhod-2AM and RH-237. The two vertical gray bands illustrate the light transmission for the band pass (580 ± 20 nm) and long pass (> 710 nm) filters. (B and C) Changes in fluorescence recorded at one pixel when the heart was only stained with either RH-237 (B) or Rhod-2 AM (C) alone.
Figure 2
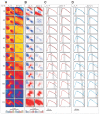
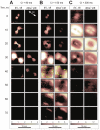
Figure 2. Vm and [Ca2+]i changes induced by S2 (−20 mA, 20 ms) as a function of S1-S2 interval
(A) Vm and [Ca2+]i distributions at the end of S2. (B) ΔVm and Δ [Ca2+]i distributions at the end of S2. (C) Action potentials (APs) and calcium transients (CTs) within the virtual cathode (white dot in A) resulting from S1-S2 stimulation (red trace) are superimposed on the signals obtained from the same pixel when S1 alone was used (black trace). (D) APs and CTs (blue) within the virtual anode (blue dot in A) are superimposed on the traces resulting from S1 (black). The vertical gray bands indicate S2 timing. The numbers on the far left are S1-S2 intervals in ms. The image size in A and B is 15 × 15 mm2.
Figure 3
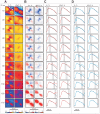
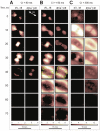
Figure 3. Vm and [Ca2+]i changes induced by S2 (+20 mA, 20 ms) as a function of S1-S2 interval
(A) Vm and [Ca2+]i distributions at the end of S2. (B) ΔVm and Δ[Ca2+]i distributions at the end of S2. (C) S1-S2 VC traces (red) are superimposed on the signals induced with S1 alone (black). (D) S1-S2 VA traces (blue) are superimposed on the signals induced with S1 alone (black). The pixel locations of the traces are indicated by white and blue dots in A.
Figure 4
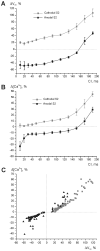
Figure 4. The maximum Vm and [Ca2+]i alterations at the central virtual electrode region during the shock as a function of S1-S2 interval
(A) Vm changes during cathodal (grey) and anodal (black) stimulation. (B) [Ca2+]i changes during cathodal (gray) and anodal (black) shocks. (C) Δ[Ca2+]i versus ΔVm for cathodal stimulation (gray squares) and anodal stimulation (black triangles) for all acquired data. S1-S2 interval ranges from 10 to 190 ms. The area directly beneath the electrode was excluded from analysis to avoid artifacts due to electroporation. Seven experiments were analyzed.
Figure 5
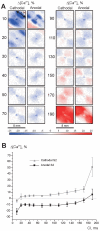
Figure 5. [Ca2+]i changes induced by cathodal and anodal S2 (20 mA, 20 ms) as a function of S1-S2 interval using blebbistatin as the uncoupler
(A) Δ[Ca2+]i distribution at the end of S2. The image size is 8 × 8 mm2. The numbers show coupling interval in ms. (B) The maximum [Ca2+]i alterations in the central virtual electrode region during the shock.
Figure 6
Figure 6. Vm and [Ca2+]i outcomes from cathodal stimulation
False color images represent Vm and [Ca2+]i derivatives as a function of time since S2 onset. The black color indicates no change in Vm and [Ca2+]i, and the white color corresponds to the maximum change in Vm and [Ca2+]i. (A) Non-propagating response at an S1-S2 interval of 90 ms. (B) Break stimulation at an S1-S2 interval of 150 ms. (C) Make stimulation at an S1-S2 interval of 300 ms. Green arrows in panel B indicate the direction of wave front propagation around the green dots.
Figure 7
Figure 7. Vm and [Ca2+]i outcomes from anodal stimulation
The S1-S2 intervals for (A) non-propagating response, (B) break stimulation and (C) make stimulation are the same as in Figure 6. Green arrows in panel B indicate the direction of wave front propagation around the green dots.

References

    1. Allingham JS, Smith R, Rayment I. The structural basis of blebbistatin inhibition and specificity for myosin II. Nat Struct Mol Biol. 2005;12:378–379. - PubMed
    1. Ashihara T, Trayanova NA. Asymmetry in membrane responses to electric shocks: insights from bidomain simulations. Biophys J. 2004;87:2271–2282. - PMC - PubMed
    1. Baxter WT, Mironov SF, Zaitsev AV, Jalife J, Pertsov AM. Visualizing excitation waves inside cardiac muscle using transillumination. Biophys J. 2001;80:516–530. - PMC - PubMed
    1. Bers DM. Ca transport during contraction and relaxation in mammalian ventricular muscle. Basic Res Cardiol. 1997;92(Suppl 1):1–10. - PubMed
    1. Bers DM. Excitation-contraction coupling and cardiac contractile force. Kluwer Academic; Dordrecht: 2001.

Publication types