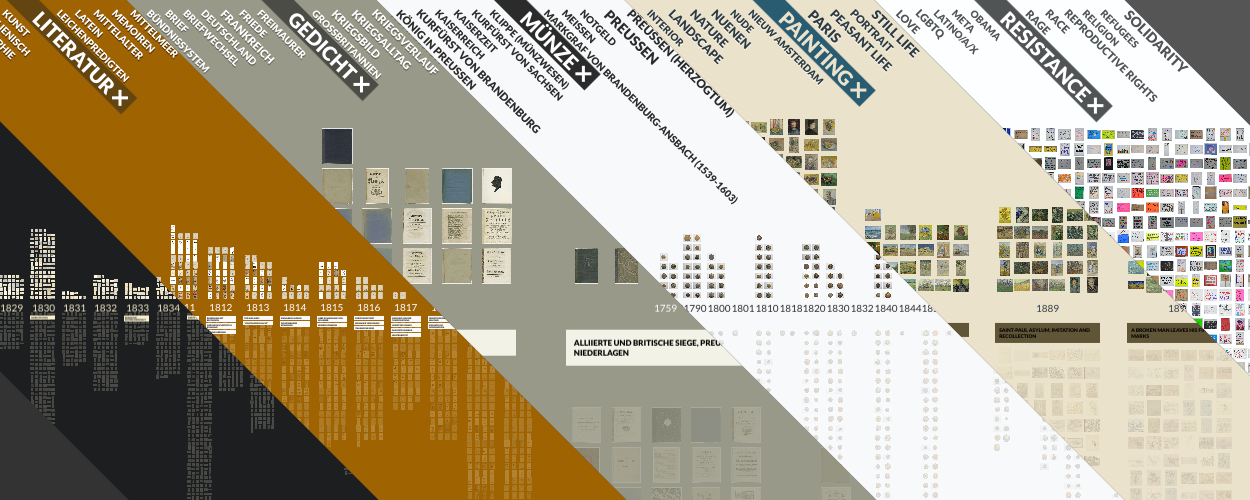
VIKUS Viewer is a web-based visualization system that arranges thousands of cultural artifacts on a dynamic canvas and supports the exploration of thematic and temporal patterns of large collections, while providing rapid access to high-resolution imagery.
This repo contains the HTML, CSS and JS of the VIKUS Viewer software. To get started you will have to clone this repo and run a webserver. We recommend nginx for production, but any web server should work. VIKUS Viewer is a static web app that requires no server-side logic ensuring long-term availability. To minimize the loading time your web server should make use of GZIP compression on JS and CSV files. Also enable HTTP/2, since multiplexing significantly helps with loading image assets.
VIKUS Viewer can be used with IIIF Collections through the vikus-IIIF-generator.
To use the VIKUS Viewer for a custom image collection, you need to prepare metadata files that describe the collection and objects, and configure the visualization. To get started, you first need to create a /data folder which will contain all metadata and image files. Have a look at the metadata generated for the Van Gogh collection (Van Gogh Museum) as a reference for the following descriptions.
You can use the latest version deployed on GitHub Pages (main branch) with your remote or local config / data using the config parameter:
https://cpietsch.github.io/vikus-viewer/?config=https://vikusviewer.fh-potsdam.de/fw4/vis/data/config.json
This is the configuration file that defines the project name, data URLs, columns, styles, and what is shown in the detail sidebar of your collection. The URLs don't have to be absolute, but it can be handy if your assets are not hosted on the same server.
The detail.structure in config.json defines the structure of the detail view. If there is no data for a field, it will not be displayed.
You can use the following types in combination with the metadata fields from data.csv. defined in source:
text: renders simple textmarkdown: renders markdownkeywords: renders an arraylink: renders a hyperlinkfunction: a custom function that can be defined in thesourcefield. Example: "column._width + 'mm * ' + column._height + 'mm'"
You can choose display to define the display of the field. Possible values are: column and wide.
Additional top-level options in config.json:
searchEnabled: set tofalseto hide the search bar (default:true)delimiter: custom delimiter used to split thekeywordsfield in data.csv (default:",")sortKeywords: controls the sort order of the keyword tag cloud. Possible values:"alphabetical"(default) – sort A–Z"alphabetical-reverse"– sort Z–A"count"– sort by number of items descending"count-reverse"– sort by number of items ascending- an array of keyword strings – display keywords in the given custom order
The data.csv holds all the metadata information for each object in the collection. The following fields are mandatory: id, keywords, year.
idis linked to the name of the corresponding image. (id: 123 -> 123.jpg)keywordscomma-separated list of keywords for the tags on the topyearcan be a number or a string, will be sorted ascending_fieldsthese are custom metadata fields (note the prefixed underscore)
The timeline.csv holds the information for the timeline displayed underneath the years.
yearcan be a number or a string, is linked to theyearfield in data.csvtitlethe headline of the blurbtextfirst detail text when zoomed in a little bitextraadditional text when zoomed to the maximum
This is the information displayed on the left side when opening the visualization. You can put in any kind of Markdown.
Apart from the metadata, you need to preprocess the image files, i.e., to generate sprites and textures for the different zoom levels. Please see the vikus-viewer-script for the details. After running the script you can place the resulting folders into /data or any other location. Make sure that the texture URLs in the config.json point to these folders.
As an alternative to the temporal view, you can create a t-SNE/UMAP layout based on image similarity. The script in vikus-viewer-script creates a tsne.csv which can be put next to the data.csv in the /data folder. Image similarity is calculated via the imagenet activation logit and then run through t-SNE. An additional spacing step ensures no overlaying images in the distribution.
You can also create the layout through a Jupyter Notebook in python using CLIP.
You can add layouts or remove the time layout in the loader.layouts section of the config.json. Multiple layouts appear as navigation buttons in the viewer.
There are two layout types:
Group layout – groups items by a metadata column (e.g. year):
{ "title": "Time", "type": "group", "groupKey": "year", "columns": 4 }groupKey– the column from data.csv to group by (e.g."year","_medium")columns– number of columns per group (optional)
CSV layout – positions items using x/y coordinates from a CSV file. Each row must contain an id column plus x and y coordinates:
{ "title": "Similarity", "url": "tsne.csv", "scale": 0.8 }url– path to the CSV file (relative to the data folder or absolute)scale– optional multiplier to manually scale the spread of the layout
You can also add a visual spacer between navigation buttons:
{ "space": true }Example loader.layouts with multiple views:
"layouts": [
  { "title": "Time", "type": "group", "groupKey": "year" },
  { "title": "Medium", "type": "group", "groupKey": "_medium", "columns": 6 },
  { "title": "Similarity", "url": "tsne.csv", "scale": 0.8 }
]VIKUS Viewer supports three filter modes, configured via the filter key in config.json.
When no filter key is set, items are filtered using a tag cloud of keywords from the keywords column in data.csv. Clicking a tag highlights matching items; clicking multiple tags narrows down to items matching all selected tags. Use the sortKeywords config option to control tag ordering.
Activate hierarchical keyword filtering by adding the following to config.json:
"filter": {
  "type": "hierarchical"
}
Keywords in data.csv must use a colon-separated hierarchy, e.g. Animals:Mammals:Dog. The viewer will display top-level categories first and reveal subcategories as the user drills down. Example: kunst-im-oeffentlichen-raum-pankow.
Crossfilter replaces the keyword bar with a panel of independent filter dimensions, each mapped to a metadata column. Selecting a value in one dimension updates the counts in all other dimensions (faceted search). Add the following to config.json:
"filter": {
  "type": "crossfilter",
  "dimensions": [
    { "label": "Medium", "source": "_medium" },
    { "label": "Artist",  "source": "_artist" }
  ]
}dimensions– array of filter dimensions. Each entry has:label– display name shown above the filter columnsource– column name from data.csv to filter on
The crossfilter panel can be styled via CSS by targeting the .crossfilter class.
VIKUS Viewer supports basic annotation features to enable visual communication with cultural collections. The following tools are available on desktop browsers and work directly on the VIKUS Viewer canvas:
Hold Shift and click on any item to highlight it. You can select multiple items in sequence to draw attention to specific objects. While holding Shift, the cursor changes to an arrow with a plus sign, indicating highlight mode.
Create simple, zoomable vector paths directly on the canvas:
- Hold Command (Mac) / Ctrl (Win) and click anywhere to add a new segment to the current path. The cursor becomes a crosshair for precise placement.
- Hold Command + Option (Mac) / Ctrl + Alt (Win) and click to start a new path. The cursor turns into an outlined plus sign (cell cursor), indicating the start of a new annotation.
The URL hash encodes the full viewer state so that specific views can be shared as links or embedded in storytelling environments such as !nflect. Browser history navigation (back/forward) also works thanks to hash updates.
The following parameters are stored in the URL hash:
| Parameter | Description |
|---|---|
filter |
Comma-separated list of active keyword filters, e.g. filter=Landscape,Portrait |
search |
Active search query, e.g. search=van+gogh |
mode |
Active layout title, e.g. mode=Similarity |
ids |
Comma-separated list of highlighted item IDs, e.g. ids=123,456 |
In addition, the following query-string parameter (not hash) controls the data source:
| Parameter | Description |
|---|---|
config |
URL to a remote config.json, e.g. ?config=https://example.com/data/config.json |
ui |
Set to 0 to hide all UI elements (search bar, navigation, info panel) for clean embedding, e.g. ?ui=0 |
To enable embedding via <iframe>, make sure the server hosting your VIKUS Viewer instance is configured with an appropriate Content-Security-Policy header.
VIKUS Viewer was designed and developed by Christopher Pietsch. The VIKUS Viewer software is based on the visualization code behind Past Visions, a collaborative effort by Katrin Glinka, Christopher Pietsch, and Marian Dörk carried out at the University of Applied Sciences Potsdam in the context of the Urban Complexity Lab during the research project VIKUS (2014-2017). Related Paper: Past Visions and Reconciling Views. The T-SNE view has been implemented for the Sphaera project with funding from Chronoi-REM
You may use VIKUS Viewer under the terms of the MIT License. See http://en.wikipedia.org/wiki/MIT_License for more information. Copyright (C) 2017-2021 Christopher Pietsch, and contributors
- Swedish Nationalmuseum by Swedish National Heritage Board
- INEL Project [2, 3] by Anne Ferger & Daniel Jettka
- WCMA Collection Explorer by WCMA Digital
- Linked Stage Graph - Stuttgart State Theatre from 1912 to 1943 by slod
- New World Nature Exploration Tool by dhinitiative
- Kunst im öffentlichen Raum Pankow
- Nico and the Navigators
- Digitale Safari - FAU Universitätsbibliothek
- Cars, Visual Contagions in Article by Nicola Carboni, University of Geneva
- The Sphere Tables - MPIWG Berlin
- Oil Paintings - Statens Museum for Kunst
- imagineRio - Rice University
- Museu da Literatura Brasileira
- Africa Art Archive Viewer
- NGA Recent Aquisitions
- Die Sammlung Emil Bührle
- Veros geheime Bibliothek