I have some data y plotted against x with asymmetric error bars yerr (=[up, down]). The data, y, contains some np.nan values at the end and likewise for yerr. However, when I plot the data using matplotlib's errorbar function, it gets this weird marker behaviour:
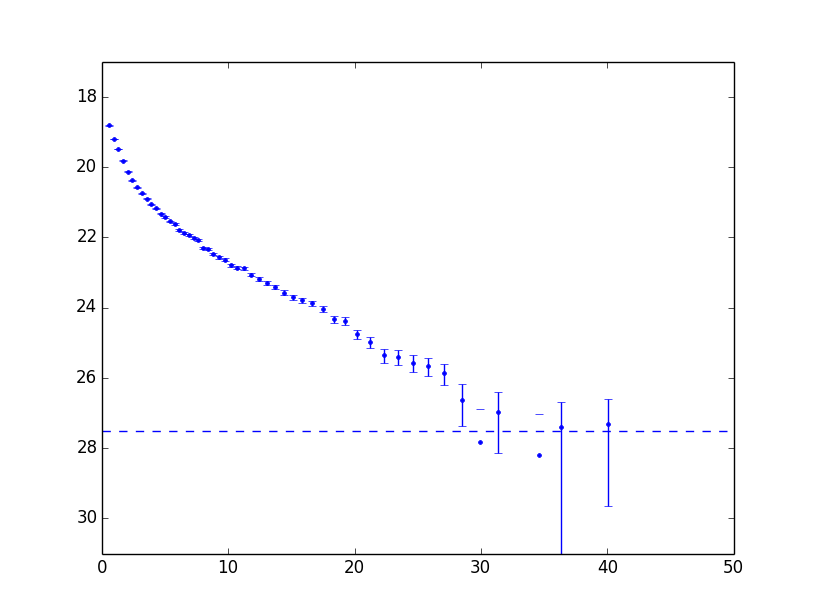
What could cause this? I ran a few checks and the nan values line up, meaning that they shouldn't be plotted at all!
Heres the function:
axis.errorbar(profile.R, profile.M, yerr=profile.MW, fmt='b.')
axis.set_ylim(axis.get_ylim()[::-1])
and here's some pictures:
after re-phrase: axis.errorbar(profile.R, profile.M, yerr=(profile.MW[0], profile.MW[1]), fmt='b.'), it still produces the same plot
after re-phrasing to use only one set:
axis.errorbar(profile.R, profile.M, yerr=(profile.MW[1], profile.MW[1]), fmt='b.')
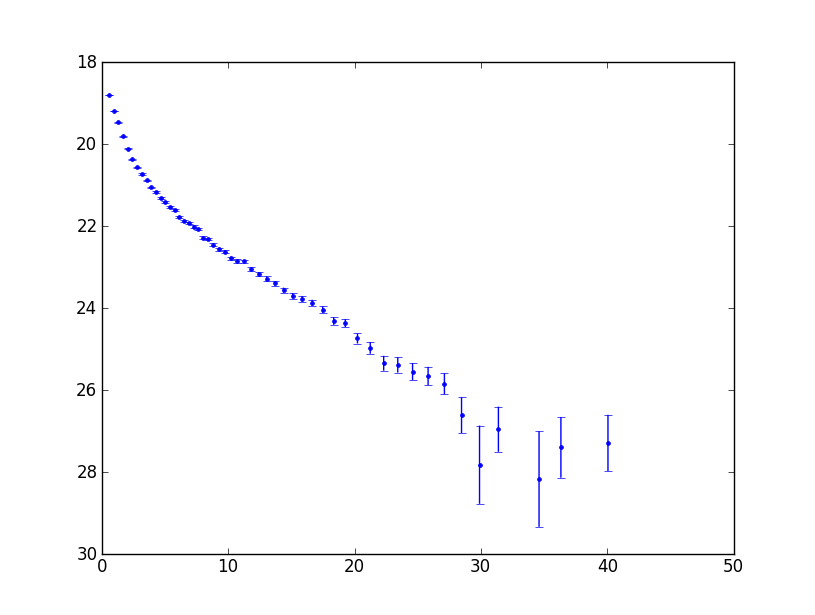
(this also happens if I use profile.MW[0])
I've also downgraded matplotlib and it still doesn't work!
But when I take the values out of their np.arrays for the last 8 elements by copy and paste (axis.errorbar([32.9592, 34.60716, 36.33696, 38.15418, 40.06254, 42.06576, 44.16756, 46.37724],[np.nan, 28.18328608, 27.41428602, np.nan, 27.30407038, np.nan, np.nan, np.nan], yerr=[[np.nan, 1.16532339, 0.73753135, np.nan, 0.68722997, np.nan, np.nan, np.nan], [np.nan, 1.16532339, 0.73753135, np.nan, 0.68722997, np.nan, np.nan, np.nan]]))
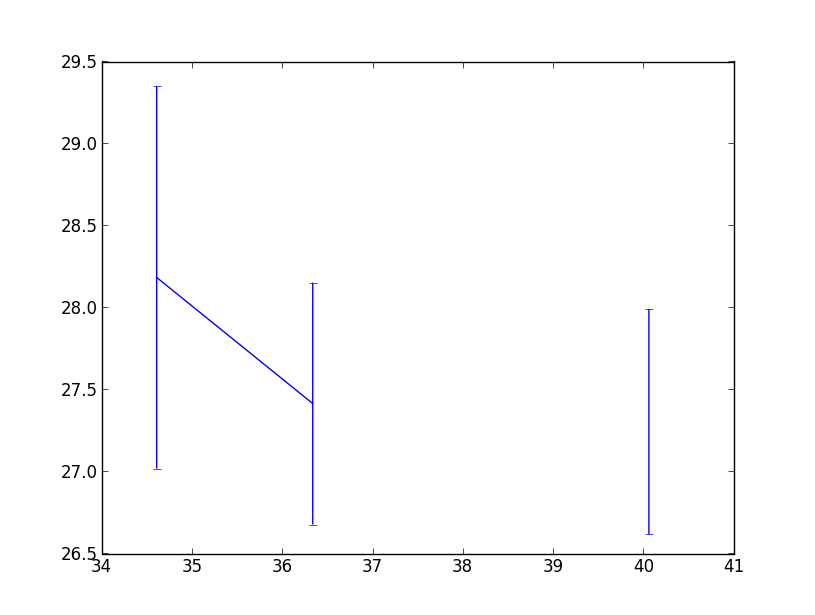
it works!! WTF!
Any ideas?
Thanks
I have some data y plotted against x with asymmetric error bars yerr (
=[up, down]). The data, y, contains somenp.nanvalues at the end and likewise for yerr. However, when I plot the data using matplotlib'serrorbarfunction, it gets this weird marker behaviour:What could cause this? I ran a few checks and the nan values line up, meaning that they shouldn't be plotted at all!
Heres the function:
axis.errorbar(profile.R, profile.M, yerr=profile.MW, fmt='b.')axis.set_ylim(axis.get_ylim()[::-1])and here's some pictures:
after re-phrase:
axis.errorbar(profile.R, profile.M, yerr=(profile.MW[0], profile.MW[1]), fmt='b.'), it still produces the same plotafter re-phrasing to use only one set:
axis.errorbar(profile.R, profile.M, yerr=(profile.MW[1], profile.MW[1]), fmt='b.')(this also happens if I use
profile.MW[0])I've also downgraded matplotlib and it still doesn't work!
But when I take the values out of their np.arrays for the last 8 elements by copy and paste (
axis.errorbar([32.9592, 34.60716, 36.33696, 38.15418, 40.06254, 42.06576, 44.16756, 46.37724],[np.nan, 28.18328608, 27.41428602, np.nan, 27.30407038, np.nan, np.nan, np.nan], yerr=[[np.nan, 1.16532339, 0.73753135, np.nan, 0.68722997, np.nan, np.nan, np.nan], [np.nan, 1.16532339, 0.73753135, np.nan, 0.68722997, np.nan, np.nan, np.nan]]))it works!! WTF!
Any ideas?
Thanks