Features Dashboard
The Dashboard is your primary view into your cable connection's health. It uses a mobile-first responsive layout that adapts from phone screens to ultrawide monitors.
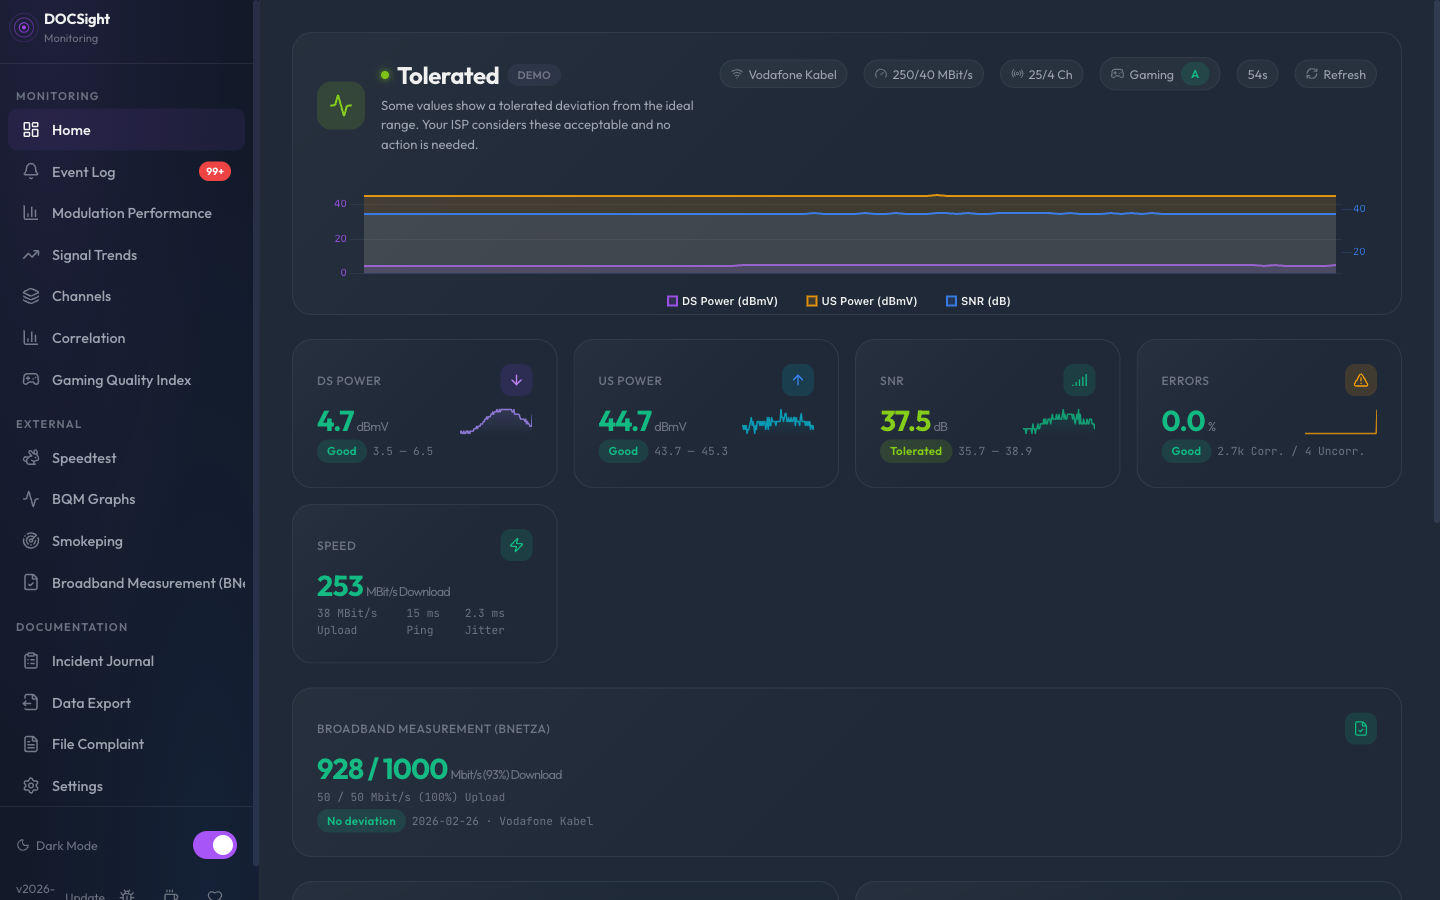
The hero card at the top combines the most important information in a single glance:
- Status dot -- Color-coded health indicator (green/lime/yellow/red)
- Health summary -- Plain-language assessment using a 4-tier system: "Good", "Tolerated", "Marginal", or "Critical" with a list of detected issues for marginal and critical states
- Provider info -- Your ISP name, modem model, and connection type
- Gaming badge -- When enabled, an A-F grade badge shows gaming readiness inline. See Gaming Quality Index for details.
- Refresh button -- Trigger an immediate modem poll without waiting for the next scheduled cycle
Five metric cards form a responsive grid below the hero card:
| Card | What It Shows |
|---|---|
| DS Power | Downstream signal level (dBmV) with health badge and reference range bar |
| US Power | Upstream transmit power (dBmV) with health badge and reference range bar |
| SNR | Signal-to-noise ratio (dB) with health badge and reference range bar |
| Errors | Uncorrectable and correctable error counts with health badge |
| Speed | Latest speedtest result (download, upload, ping, jitter) with color coding against booked speed |
Each card shows a health badge indicating the metric's status:
- Good -- Within ideal DOCSIS parameters
- Tolerated -- Outside ideal range but ISP considers acceptable; no action needed
- Marginal -- Approaching problematic levels, worth monitoring
- Critical -- Outside spec, likely affecting your connection
Click any card to expand per-channel details.
The speed card compares your actual speed against your booked speed (from Fritz!Box connection info or manual settings):
- Green: >= 80% of booked speed
- Yellow: 50-80% of booked speed
- Red: < 50% of booked speed
Below the metric cards, health rings provide a visual summary of your connection's overall quality. Each ring represents a metric category (downstream, upstream, errors) with fill level and color indicating health status at a glance.
Channel details are organized in clean, grouped tables:
- Downstream Channels -- Grouped by DOCSIS version (3.0 SC-QAM / 3.1 OFDM), with per-channel power, SNR, and health indicators
- Upstream Channels -- Per-channel transmit power, modulation, theoretical bitrate (e.g. "30.72 Mbit/s" for 64-QAM), and warnings for individual issues. Bitrate cells turn amber/red when modulation degrades.
Tables collapse into expandable groups on smaller screens.
The 5 most recent events from the last 24 hours appear below the hero card. See Event Log for details.
Use the date navigator in the topbar to browse historical snapshots. Navigate by day to see how your connection looked at any point in the past.
The dashboard adapts to your screen size:
| Viewport | Layout |
|---|---|
| Desktop (>1024px) | Full sidebar, 5-column metric grid, expanded channel tables |
| Tablet (768-1024px) | Collapsed sidebar, 3-column metric grid, grouped tables |
| Mobile (<768px) | Sticky header, bottom tab bar, single-column cards, swipeable sections |
On mobile, the sticky header keeps the health status visible while scrolling, and a bottom tab bar provides quick navigation between Dashboard, Trends, Events, and Settings.
When DOCSight is configured with the Generic Router driver (for fiber, DSL, or satellite connections), the dashboard adapts automatically:
- The DOCSIS-specific sections (metric cards for DS Power, US Power, SNR, Errors, health rings, and channel tables) are replaced with a "Generic Router Mode" placeholder explaining that DOCSIS channel data is not available.
- Non-DOCSIS cards still render below the placeholder: Speedtest (if configured), BNetzA (if enabled), and any module-contributed dashboard cards.
- The hero card still shows your ISP name, modem model ("Generic Router"), and a refresh button.
This lets users on non-cable connections benefit from DOCSight's speedtest tracking, incident journal, BNetzA integration, and other features without needing a DOCSIS modem.
DOCSight is installable as a Progressive Web App. Add it to your home screen for a native app experience with offline access to your most recent dashboard snapshot.