Features BQM
DOCSight can fetch and archive daily broadband quality graphs from ThinkBroadband BQM.
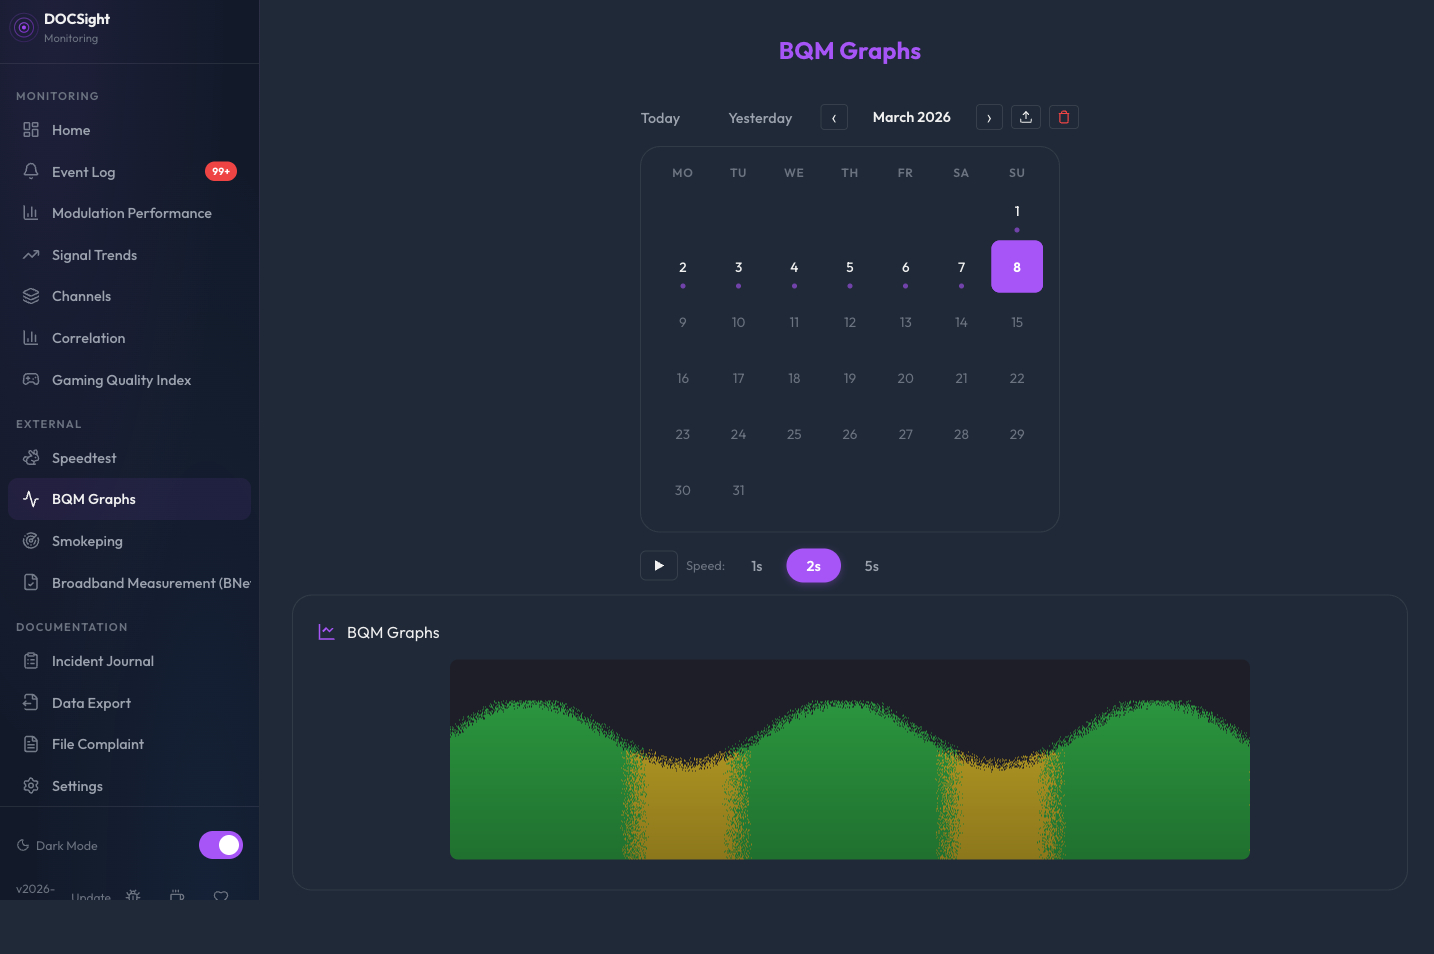
ThinkBroadband's Broadband Quality Monitor is an external service that measures your connection's latency, packet loss, and jitter from outside your network. This complements DOCSight's internal DOCSIS monitoring by showing what your connection looks like from the internet's perspective.
- Create a free BQM account at thinkbroadband.com
- Get your BQM share URL (the
.pnggraph link) - In DOCSight Settings, expand ThinkBroadband BQM
- Enter your BQM share URL
- Save
DOCSight fetches the graph daily and stores it for historical browsing.
The BQM view shows a month calendar grid for navigating archived graphs:
- Day cells with a purple dot indicate dates that have BQM data
- Today is highlighted with a ring indicator
- Selected date is highlighted with a filled background
- Click any day with data to load that graph
- Today / Yesterday buttons for fast access
- Month navigation arrows to browse previous months
When viewing today's date, DOCSight fetches a live graph directly from ThinkBroadband instead of showing the daily archive. The live image:
- Auto-refreshes approximately every 15–17 minutes while the BQM view is active
- Shows a Live badge and last-updated timestamp
- Falls back gracefully to the cached daily image if the live fetch fails
Polling jitter: Each refresh cycle adds a random offset of 0–120 seconds to the 15-minute base interval. This prevents multiple DOCSight instances (or browser tabs) from hitting ThinkBroadband at the exact same moment, reducing server load and avoiding rate limiting.
DOCSight collects the daily BQM graph once per day at the configured time (default: 02:00). To avoid all instances requesting the graph simultaneously, each instance applies a random spread offset of 0–120 minutes on startup. This offset is subtracted from the configured collection time and remains constant for the lifetime of the process.
For example, with the default 02:00 collection time, different instances will collect between 00:00 and 02:00.
Note: The spread offset only affects when the graph is fetched, not which date the graph is stored as. Graphs collected before 12:00 are always stored as the previous day's date, regardless of the offset.
Browse through multiple days automatically:
- Select a range: Click a date, then Shift+click another date to highlight a range
- Play: Click the play button (or press Space) to start stepping through available dates
- Speed: Choose 1s, 2s, or 5s per image
- Pause/Resume: Click play again or press Space
- Stop: Click stop or press Escape to reset
Keyboard shortcuts (when BQM view is active):
| Key | Action |
|---|---|
| Space | Play / Pause slideshow |
| Escape | Stop slideshow |
| Left Arrow | Previous frame (pauses if playing) |
| Right Arrow | Next frame (pauses if playing) |
When you select a date range in Signal Trends or the Incident Journal timeline, switching to the BQM view pre-selects that same range in the calendar. This makes it easy to correlate DOCSIS signal issues with external quality data.